Celeriac nutrition: calories, carbs, GI, protein, fiber, fats
Carbs in Celeriac
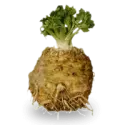
Celeriac is the root of celery; it is mainly composed of water. The total carbohydrate component of celeriac is equal to 9.2g. This amount covers 3% of the DV of carbohydrates.
The chart below indicates the carbohydrate ratio with the macronutrient values.
Macronutrients chart
Carbs per serving size
The serving size of celeriac is 1 cup, equivalent to 156g. One cup of celeriac contains 13.98 grams of carbs.
The net carb of 1 serving is 11.54g.
Carbohydrate type breakdown
Net carbs in celeriac
Net carbs in 100g of celeriac are equal to 7.4g. As mentioned above, it is equivalent to 11.54g in 1 serving.
Fiber distribution in celeriac
Celeriac contains 1.8g of fibers per 100g. It contains 2.8g of fibers, equivalent to 1 serving size. The fiber distribution is important to consider when adding celeriac to a diet.
Celeriac contains both soluble and insoluble fiber. It is particularly rich in insoluble fiber, which helps to maintain healthy blood cholesterol levels.
Fiber content ratio for Celeriac
Comparison to other fruits
Celeriac as a root vegetable can be compared to different foods belonging to the same category. The table below highlights those comparisons
| Food | Carbs (per serving) | Carbs per 100g |
| Celeriac | 13.98g | 9.2g |
| Parsnip | 24g (133g) | 18g |
| Turnip | 0.96g (15g) | 6.4g |
| Carrot | 5.9g (61g) | 9.6g |
| Daikon | 4.7g (116g) | 4.1g |
| Jicama | 10.56g (120g) | 8.8g |

Top nutrition facts for Celeriac
| Calories ⓘ Calories for selected serving | 42 kcal |
| Glycemic index ⓘ Gi values are taken from various scientific sources. GI values less than 55 are considered as low. Values above 70 are considered as high. | 35 (low) |
| Glycemic load ⓘ Glycemic Load (GL) is a metric that measures both the quality (Glycemic Index) and quantity of carbohydrates in a specific serving of food to estimate its impact on blood sugar levels. It is calculated as: (GI × Carbs in grams) / 100. | 4 (low) |
| Net carbs ⓘ Net Carbs = Total Carbohydrates – Fiber – Sugar Alcohols | 7 g |
| Default serving size ⓘ Serving sizes are mostly taken from FDA's Reference Amounts Customarily Consumed (RACCs) | 1 cup (156 g) |
| Acidity (Based on PRAL) ⓘ PRAL (Potential renal acid load) is calculated using a formula. On the PRAL scale the higher the positive value, the more is the acidifying effect on the body. The lower the negative value, the higher the alkalinity of the food. 0 is neutral. | -2.4 (alkaline) |
| Oxalates | 7 mg ⓘ https://www.sciencedirect.com/science/article/abs/pii/S0308814602002121 |
Celeriac calories (kcal)
| Calories for different serving sizes of celeriac | Calories | Weight |
|---|---|---|
| Calories in 100 grams | 42 | |
| Calories in 1 cup | 66 | 156 g |
| Calories for different varieties of celeriac | Calories | Weight |
|---|---|---|
| Celeriac, raw (this food) | 42 | 100 g |
| Celeriac, cooked, boiled, drained, without salt | 27 | 100 g |
| Celeriac, cooked, boiled, drained, with salt | 27 | 100 g |
Extra Nutrition facts for Celeriac
| Protein per 100 calories ⓘ Shows how many grams of protein you get from 100 calories of this food, calculated as (protein in g ÷ calories) × 100. | 3.6 g |
| Calories per 10 g protein ⓘ Shows how many calories you need to eat from this food to get 10 g of protein, calculated as (calories ÷ protein in g) × 10. | 280 kcal |
| Weight per 100 calories ⓘ Shows how many grams of this food equal 100 kcal—higher grams mean a larger portion for the same calories. | 238 g |
Celeriac Glycemic index (GI)
Celeriac Glycemic load (GL)
Mineral coverage chart
Mineral chart - relative view
Vitamin coverage chart
Vitamin chart - relative view
Fat type information
All nutrients for Celeriac per 100g
| Nutrient | Value | DV% | In TOP % of foods | Comparison |
| Vitamin A | 0µg | 0% | 100% | |
| Calories | 42kcal | 2% | 91% |
1.1 times less than Orange
|
| Protein | 1.5g | 4% | 82% |
1.9 times less than Broccoli
|
| Protein per 100 calories | 3.6g | N/A | 55% | |
| Calories per 10 g protein | 280kcal | N/A | 42% | |
| Weight per 100 calories | 238g | N/A | 10% | |
| Fats | 0.3g | 0% | 85% |
111 times less than Cheese
|
| Vitamin C | 8mg | 9% | 17% |
6.6 times less than Lemon
|
| Carbs | 9.2g | 3% | 51% |
3.1 times less than Rice
|
| Net carbs | 7.4g | N/A | 51% |
7.3 times less than Chocolate
|
| Cholesterol | 0mg | 0% | 100% |
N/A
|
| Vitamin D* | 0 IU | 0% | 100% |
N/A
|
| Vitamin D | 0µg | 0% | 100% |
N/A
|
| Magnesium | 20mg | 5% | 53% |
7 times less than Almonds
|
| Calcium | 43mg | 4% | 33% |
2.9 times less than Milk
|
| Potassium | 300mg | 9% | 32% |
2 times more than Cucumber
|
| Iron | 0.7mg | 9% | 69% |
3.7 times less than Beef broiled
|
| Sugar | 1.6g | N/A | 42% |
5.6 times less than Coca-Cola
|
| Fiber | 1.8g | 7% | 33% |
1.3 times less than Orange
|
| Copper | 0.07mg | 8% | 56% |
2 times less than Shiitake
|
| Zinc | 0.33mg | 3% | 70% |
19.1 times less than Beef broiled
|
| Phosphorus | 115mg | 16% | 54% |
1.6 times less than Chicken meat
|
| Sodium | 100mg | 4% | 48% |
4.9 times less than White bread
|
| Vitamin E | 0.36mg | 2% | 31% |
4.1 times less than Kiwi
|
| Selenium | 0.7µg | 1% | 67% | |
| Manganese | 0.16mg | 7% | 31% | |
| Vitamin B1 | 0.05mg | 4% | 66% |
5.3 times less than Pea raw
|
| Vitamin B2 | 0.06mg | 5% | 72% |
2.2 times less than Avocado
|
| Vitamin B3 | 0.7mg | 4% | 67% |
13.7 times less than Turkey meat
|
| Vitamin B5 | 0.35mg | 7% | 44% |
3.2 times less than Sunflower seeds
|
| Vitamin B6 | 0.17mg | 13% | 43% |
1.4 times more than Oats
|
| Vitamin B12 | 0µg | 0% | 100% |
N/A
|
| Vitamin K | 41µg | 34% | 4% |
2.5 times less than Broccoli
|
| Trans fat | 0g | N/A | 100% |
N/A
|
| Folate | 8µg | 2% | 54% |
7.6 times less than Brussels sprouts
|
| Choline | 9mg | 2% | 41% | |
| Saturated fat | 0.08g | 0% | 79% |
74.6 times less than Beef broiled
|
| Monounsaturated fat | 0.06g | N/A | 77% |
168.9 times less than Avocado
|
| Polyunsaturated fat | 0.15g | N/A | 75% |
318.7 times less than Walnut
|
| Caffeine | 0mg | 0% | 100% | |
| Omega-3 - EPA | 0g | N/A | 100% |
N/A
|
| Omega-3 - DHA | 0g | N/A | 100% |
N/A
|
| Omega-3 - DPA | 0g | N/A | 100% |
N/A
|
Check out similar food or compare with current
NUTRITION FACTS LABEL
Serving Size ______________
Health checks
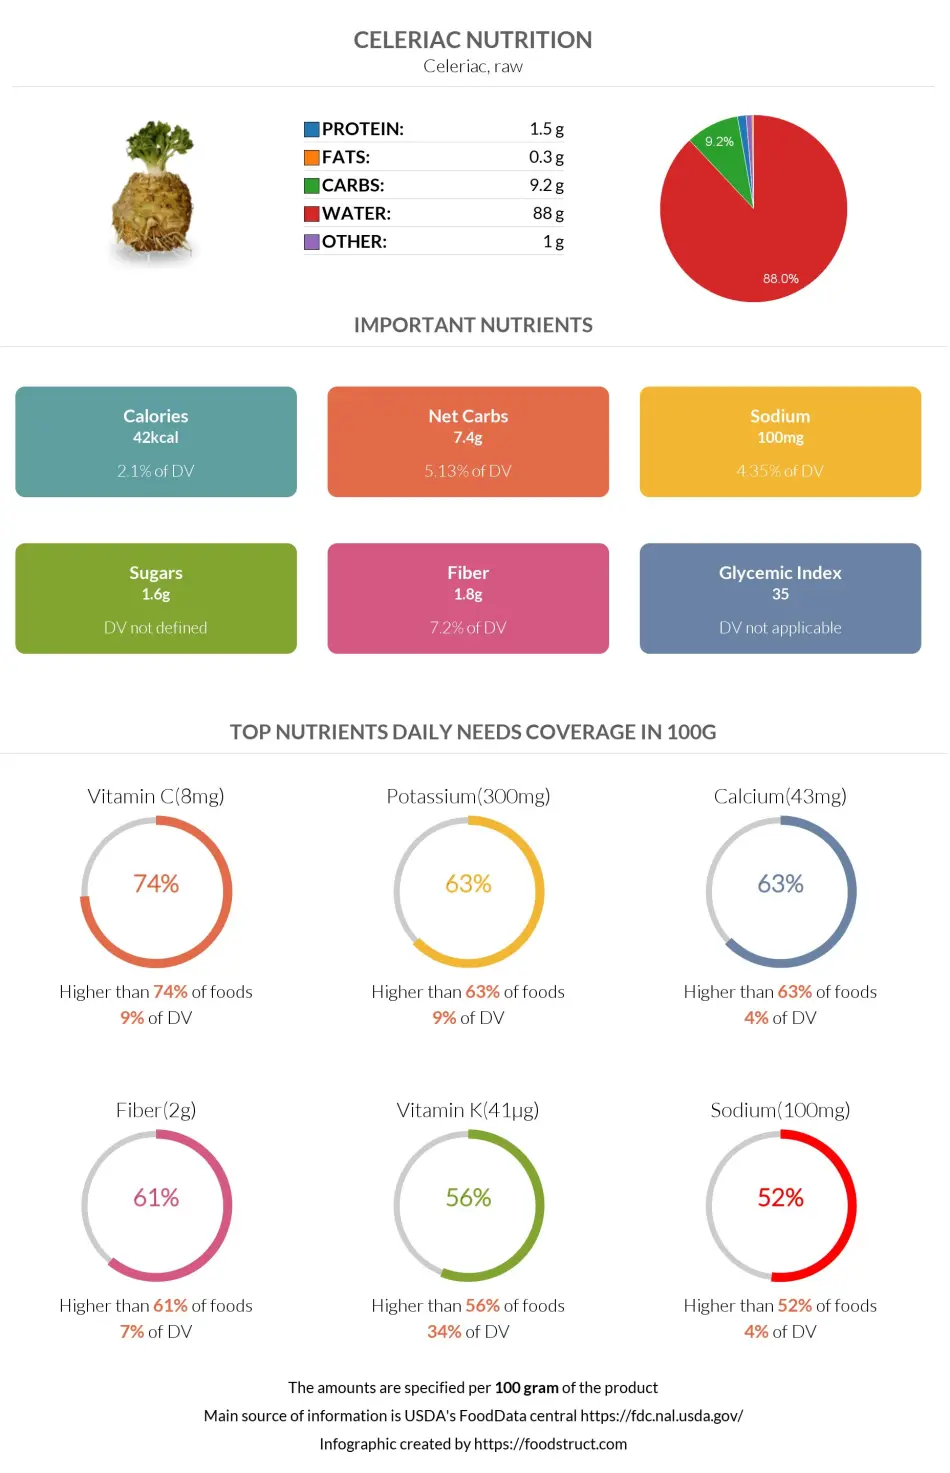
Celeriac nutrition infographic
References
All the values for which the sources are not specified explicitly are taken from FDA’s Food Central. The exact link to the food presented on this page can be found below.