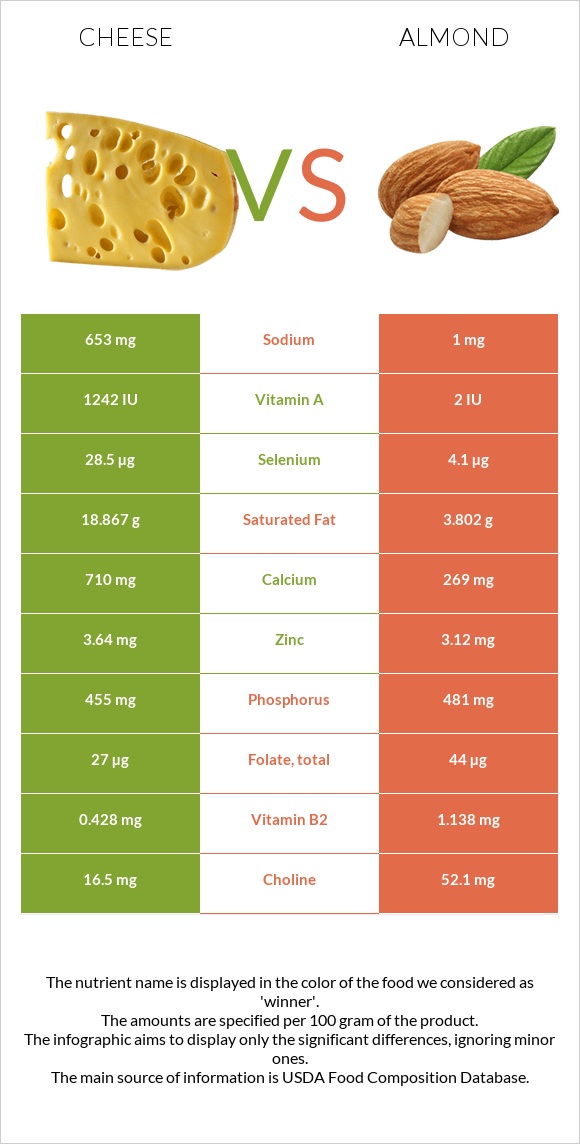
Significant differences between cheese and almonds Cheese has more vitamin B12 and selenium; however, almonds are richer in vitamin E, copper, manganese, magnesium, vitamin B2, fiber, and iron. Almonds cover your daily vitamin E needs 166% more than cheese. Almonds contain less saturated fat. Specific food types used in this comparison are Cheese, cheddar and Nuts, almonds .
Infographic
Mineral Comparison
Mineral comparison score is based on the number of minerals by which one or the other food is richer. The "coverage" charts below show how much of the daily needs can be covered by 300 grams of the food.
3
100 g
300 g
1 cubic inch - 17g 1 slice (1 oz) - 28g 1 oz - 28.35g 1 cup, shredded - 113g 1 cup, diced - 132g 1 cup, melted - 244g
Magnesium
Magnesium
Calcium
Calcium
Potassium
Potassium
Iron
Iron
Copper
Copper
Zinc
Zinc
Phosphorus
Phosphorus
Sodium
Sodium
Manganese
Manganese
Selenium
Selenium
19%
213%
6.7%
5.3%
10%
99%
195%
85%
3.5%
155%
6
100 g
300 g
1 almond - 1.2g 1 oz (23 whole kernels) - 28.35g 1 cup, sliced - 92g 1 cup, ground - 95g 1 cup, slivered - 108g 1 cup, whole - 143g
Magnesium
Magnesium
Calcium
Calcium
Potassium
Potassium
Iron
Iron
Copper
Copper
Zinc
Zinc
Phosphorus
Phosphorus
Sodium
Sodium
Manganese
Manganese
Selenium
Selenium
193%
81%
65%
139%
344%
85%
206%
0.13%
284%
22%
Vitamin Comparison
Vitamin comparison score is based on the number of vitamins by which one or the other food is richer. The "coverage" charts below show how much of the daily needs can be covered by 300 grams of the food.
4
100 g
300 g
1 cubic inch - 17g 1 slice (1 oz) - 28g 1 oz - 28.35g 1 cup, shredded - 113g 1 cup, diced - 132g 1 cup, melted - 244g
Vitamin C
Vit. C
Vitamin D
Vit. D
Vitamin A
Vit. A
Vitamin E
Vit. E
Vitamin B1
Vit. B1
Vitamin B2
Vit. B2
Vitamin B3
Vit. B3
Vitamin B5
Vit. B5
Vitamin B6
Vit. B6
Vitamin B12
Vit. B12
Vitamin K
Vit. K
Folate
Folate
0%
9%
110%
14%
7.3%
99%
1.1%
25%
15%
138%
6%
20%
7
100 g
300 g
1 almond - 1.2g 1 oz (23 whole kernels) - 28.35g 1 cup, sliced - 92g 1 cup, ground - 95g 1 cup, slivered - 108g 1 cup, whole - 143g
Vitamin C
Vit. C
Vitamin D
Vit. D
Vitamin A
Vit. A
Vitamin E
Vit. E
Vitamin B1
Vit. B1
Vitamin B2
Vit. B2
Vitamin B3
Vit. B3
Vitamin B5
Vit. B5
Vitamin B6
Vit. B6
Vitamin B12
Vit. B12
Vitamin K
Vit. K
Folate
Folate
0%
0%
0%
513%
51%
263%
68%
28%
32%
0%
0%
33%
All nutrients comparison - raw data values
Nutrient
DV% diff.
Vitamin E
0.71mg
25.63mg
166%
Copper
0.03mg
1.031mg
111%
Manganese
0.027mg
2.179mg
94%
Polyunsaturated fat
1.421g
12.329g
73%
Saturated fat
18.867g
3.802g
68%
Magnesium
27mg
270mg
58%
Monounsaturated fat
9.246g
31.551g
56%
Vitamin B2
0.428mg
1.138mg
55%
Fiber
0g
12.5g
50%
Vitamin B12
1.1µg
0µg
46%
Iron
0.14mg
3.71mg
45%
Calcium
710mg
269mg
44%
Selenium
28.5µg
4.1µg
44%
Vitamin A
330µg
0µg
37%
Cholesterol
99mg
0mg
33%
Sodium
653mg
1mg
28%
Fats
33.31g
49.93g
26%
Vitamin B3
0.059mg
3.618mg
22%
Potassium
76mg
733mg
19%
Vitamin B1
0.029mg
0.205mg
15%
Calories
404kcal
579kcal
9%
Carbs
3.09g
21.55g
6%
Choline
16.5mg
52.1mg
6%
Zinc
3.64mg
3.12mg
5%
Vitamin B6
0.066mg
0.137mg
5%
Phosphorus
455mg
481mg
4%
Folate
27µg
44µg
4%
Protein
22.87g
21.15g
3%
Vitamin D*
24 IU
0 IU
3%
Vitamin D
0.6µg
0µg
3%
Vitamin K
2.4µg
0µg
2%
Vitamin B5
0.41mg
0.471mg
1%
Protein per 100 calories
5.7g
3.7g
N/A
Calories per 10 g protein
177kcal
274kcal
N/A
Weight per 100 calories
25g
17g
N/A
Unsaturated / Saturated Fat ratio
0.57
12
N/A
Net carbs
3.09g
9.05g
N/A
Sugar
0.48g
4.35g
N/A
Starch
0.72g
0%
Trans fat
0.917g
0.015g
N/A
Tryptophan
0.547mg
0.211mg
0%
Threonine
1.044mg
0.601mg
0%
Isoleucine
1.206mg
0.751mg
0%
Leucine
1.939mg
1.473mg
0%
Lysine
1.025mg
0.568mg
0%
Methionine
0.547mg
0.157mg
0%
Phenylalanine
1.074mg
1.132mg
0%
Valine
1.404mg
0.855mg
0%
Histidine
0.547mg
0.539mg
0%
Fructose
0g
0.11g
0%
Omega-3 - EPA
0.01g
0g
N/A
Omega-3 - DHA
0.001g
0g
N/A
Omega-3 - ALA
0.003g
N/A
Omega-3 - DPA
0.017g
0g
N/A
Omega-6 - Eicosadienoic acid
0.007g
0.002g
N/A
Omega-6 - Linoleic acid
12.32g
N/A
Macronutrient Comparison
Macronutrient breakdown side-by-side comparison
3
23%
33%
3%
37%
4%
Protein:
22.87 g
Fats:
33.31 g
Carbs:
3.09 g
Water:
37.02 g
Other:
3.71 g
2
21%
50%
22%
4%
3%
Protein:
21.15 g
Fats:
49.93 g
Carbs:
21.55 g
Water:
4.41 g
Other:
2.96 g
Contains
more
Water Water
+739.5%
Contains
more
Other Other
+25.3%
Contains
more
Fats Fats
+49.9%
Contains
more
Carbs Carbs
+597.4%
~equal in
Protein
~21.15g
Fat Type Comparison
Fat type breakdown side-by-side comparison
0
64%
31%
5%
Saturated fat:
Sat. Fat
18.867 g
Monounsaturated fat:
Mono. Fat
9.246 g
Polyunsaturated fat:
Poly. Fat
1.421 g
3
8%
66%
26%
Saturated fat:
Sat. Fat
3.802 g
Monounsaturated fat:
Mono. Fat
31.551 g
Polyunsaturated fat:
Poly. Fat
12.329 g
Contains
less
Sat. Fat Saturated fat
-79.8%
Contains
more
Mono. Fat Monounsaturated fat
+241.2%
Contains
more
Poly. Fat Polyunsaturated fat
+767.6%
Carbohydrate type comparison
Carbohydrate type breakdown side-by-side comparison
3
54%
25%
21%
Starch:
0 g
Sucrose:
0 g
Glucose:
0.26 g
Fructose:
0 g
Lactose:
0.12 g
Maltose:
0 g
Galactose:
0.1 g
4
14%
78%
3%
2%
Starch:
0.72 g
Sucrose:
3.95 g
Glucose:
0.17 g
Fructose:
0.11 g
Lactose:
0 g
Maltose:
0.04 g
Galactose:
0.07 g
Contains
more
Glucose Glucose
+52.9%
Contains
more
Lactose Lactose
+∞%
Contains
more
Galactose Galactose
+42.9%
Contains
more
Starch Starch
+∞%
Contains
more
Sucrose Sucrose
+∞%
Contains
more
Fructose Fructose
+∞%
Contains
more
Maltose Maltose
+∞%