Summary of differences between cheese and molasses Cheese has more phosphorus, calcium, and vitamin B12; however, molasses are higher in manganese, iron, magnesium, copper, vitamin B6, and potassium. Cheese covers your daily need for saturated fat, 94% more than molasses. Molasses have less saturated fat. These are the specific foods used in this comparison Cheese, cheddar and Molasses .
Infographic
Mineral Comparison
Mineral comparison score is based on the number of minerals by which one or the other food is richer. The "coverage" charts below show how much of the daily needs can be covered by 300 grams of the food.
4
100 g
300 g
1 cubic inch - 17g 1 slice (1 oz) - 28g 1 oz - 28.35g 1 cup, shredded - 113g 1 cup, diced - 132g 1 cup, melted - 244g
Magnesium
Magnesium
Calcium
Calcium
Potassium
Potassium
Iron
Iron
Copper
Copper
Zinc
Zinc
Phosphorus
Phosphorus
Sodium
Sodium
Manganese
Manganese
Selenium
Selenium
19%
213%
6.7%
5.3%
10%
99%
195%
85%
3.5%
155%
6
100 g
300 g
1 serving 1 tbsp - 20g 1 cup - 337g
Magnesium
Magnesium
Calcium
Calcium
Potassium
Potassium
Iron
Iron
Copper
Copper
Zinc
Zinc
Phosphorus
Phosphorus
Sodium
Sodium
Manganese
Manganese
Selenium
Selenium
173%
62%
129%
177%
162%
7.9%
13%
4.8%
200%
97%
Vitamin Comparison
Vitamin comparison score is based on the number of vitamins by which one or the other food is richer. The "coverage" charts below show how much of the daily needs can be covered by 300 grams of the food.
7
100 g
300 g
1 cubic inch - 17g 1 slice (1 oz) - 28g 1 oz - 28.35g 1 cup, shredded - 113g 1 cup, diced - 132g 1 cup, melted - 244g
Vitamin C
Vit. C
Vitamin D
Vit. D
Vitamin A
Vit. A
Vitamin E
Vit. E
Vitamin B1
Vit. B1
Vitamin B2
Vit. B2
Vitamin B3
Vit. B3
Vitamin B5
Vit. B5
Vitamin B6
Vit. B6
Vitamin B12
Vit. B12
Vitamin K
Vit. K
Folate
Folate
0%
9%
110%
14%
7.3%
99%
1.1%
25%
15%
138%
6%
20%
4
100 g
300 g
1 serving 1 tbsp - 20g 1 cup - 337g
Vitamin C
Vit. C
Vitamin D
Vit. D
Vitamin A
Vit. A
Vitamin E
Vit. E
Vitamin B1
Vit. B1
Vitamin B2
Vit. B2
Vitamin B3
Vit. B3
Vitamin B5
Vit. B5
Vitamin B6
Vit. B6
Vitamin B12
Vit. B12
Vitamin K
Vit. K
Folate
Folate
0%
0%
0%
0%
10%
0.46%
17%
48%
155%
0%
0%
0%
All nutrients comparison - raw data values
Nutrient
DV% diff.
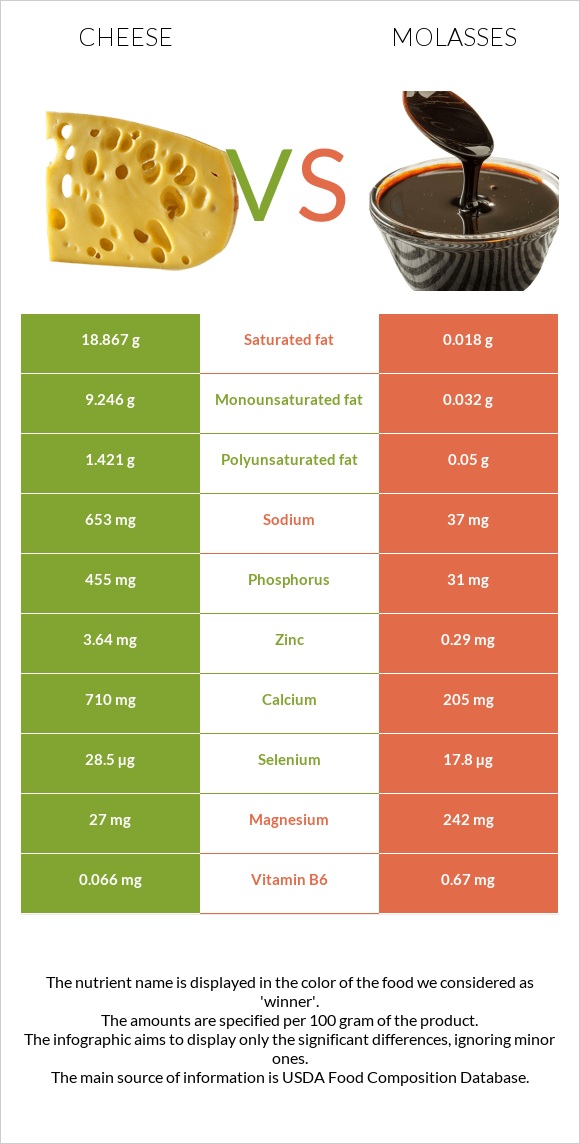
Saturated fat
18.867g
0.018g
86%
Manganese
0.027mg
1.53mg
65%
Phosphorus
455mg
31mg
61%
Iron
0.14mg
4.72mg
57%
Fats
33.31g
0.1g
51%
Magnesium
27mg
242mg
51%
Calcium
710mg
205mg
51%
Copper
0.03mg
0.487mg
51%
Protein
22.87g
0g
46%
Vitamin B6
0.066mg
0.67mg
46%
Vitamin B12
1.1µg
0µg
46%
Potassium
76mg
1464mg
41%
Vitamin A
330µg
0µg
37%
Cholesterol
99mg
0mg
33%
Vitamin B2
0.428mg
0.002mg
33%
Zinc
3.64mg
0.29mg
30%
Sodium
653mg
37mg
27%
Carbs
3.09g
74.73g
24%
Monounsaturated fat
9.246g
0.032g
23%
Selenium
28.5µg
17.8µg
19%
Fructose
0g
12.79g
16%
Polyunsaturated fat
1.421g
0.05g
9%
Vitamin B5
0.41mg
0.804mg
8%
Folate
27µg
0µg
7%
Calories
404kcal
290kcal
6%
Vitamin E
0.71mg
0mg
5%
Vitamin B3
0.059mg
0.93mg
5%
Vitamin D*
24 IU
0 IU
3%
Vitamin D
0.6µg
0µg
3%
Vitamin K
2.4µg
0µg
2%
Vitamin B1
0.029mg
0.041mg
1%
Choline
16.5mg
13.3mg
1%
Protein per 100 calories
5.7g
0g
N/A
Calories per 10 g protein
177kcal
N/A
Weight per 100 calories
25g
34g
N/A
Unsaturated / Saturated Fat ratio
0.57
4.6
N/A
Net carbs
3.09g
74.73g
N/A
Sugar
0.48g
74.72g
N/A
Trans fat
0.917g
N/A
Tryptophan
0.547mg
0%
Threonine
1.044mg
0%
Isoleucine
1.206mg
0%
Leucine
1.939mg
0%
Lysine
1.025mg
0%
Methionine
0.547mg
0%
Phenylalanine
1.074mg
0%
Valine
1.404mg
0%
Histidine
0.547mg
0%
Omega-3 - EPA
0.01g
0g
N/A
Omega-3 - DHA
0.001g
0g
N/A
Omega-3 - DPA
0.017g
0g
N/A
Omega-6 - Eicosadienoic acid
0.007g
N/A
Macronutrient Comparison
Macronutrient breakdown side-by-side comparison
4
23%
33%
3%
37%
4%
Protein:
22.87 g
Fats:
33.31 g
Carbs:
3.09 g
Water:
37.02 g
Other:
3.71 g
1
75%
22%
3%
Protein:
0 g
Fats:
0.1 g
Carbs:
74.73 g
Water:
21.87 g
Other:
3.3 g
Contains
more
Protein Protein
+∞%
Contains
more
Fats Fats
+33210%
Contains
more
Water Water
+69.3%
Contains
more
Other Other
+12.4%
Contains
more
Carbs Carbs
+2318.4%
Fat Type Comparison
Fat type breakdown side-by-side comparison
2
64%
31%
5%
Saturated fat:
Sat. Fat
18.867 g
Monounsaturated fat:
Mono. Fat
9.246 g
Polyunsaturated fat:
Poly. Fat
1.421 g
1
18%
32%
50%
Saturated fat:
Sat. Fat
0.018 g
Monounsaturated fat:
Mono. Fat
0.032 g
Polyunsaturated fat:
Poly. Fat
0.05 g
Contains
more
Mono. Fat Monounsaturated fat
+28793.8%
Contains
more
Poly. Fat Polyunsaturated fat
+2742%
Contains
less
Sat. Fat Saturated fat
-99.9%
Carbohydrate type comparison
Carbohydrate type breakdown side-by-side comparison
2
54%
25%
21%
Starch:
0 g
Sucrose:
0 g
Glucose:
0.26 g
Fructose:
0 g
Lactose:
0.12 g
Maltose:
0 g
Galactose:
0.1 g
3
54%
22%
24%
Starch:
0 g
Sucrose:
29.4 g
Glucose:
11.92 g
Fructose:
12.79 g
Lactose:
0 g
Maltose:
0 g
Galactose:
0 g
Contains
more
Lactose Lactose
+∞%
Contains
more
Galactose Galactose
+∞%
Contains
more
Sucrose Sucrose
+∞%
Contains
more
Glucose Glucose
+4484.6%
Contains
more
Fructose Fructose
+∞%
~equal in
Starch
~0g
~equal in
Maltose
~0g