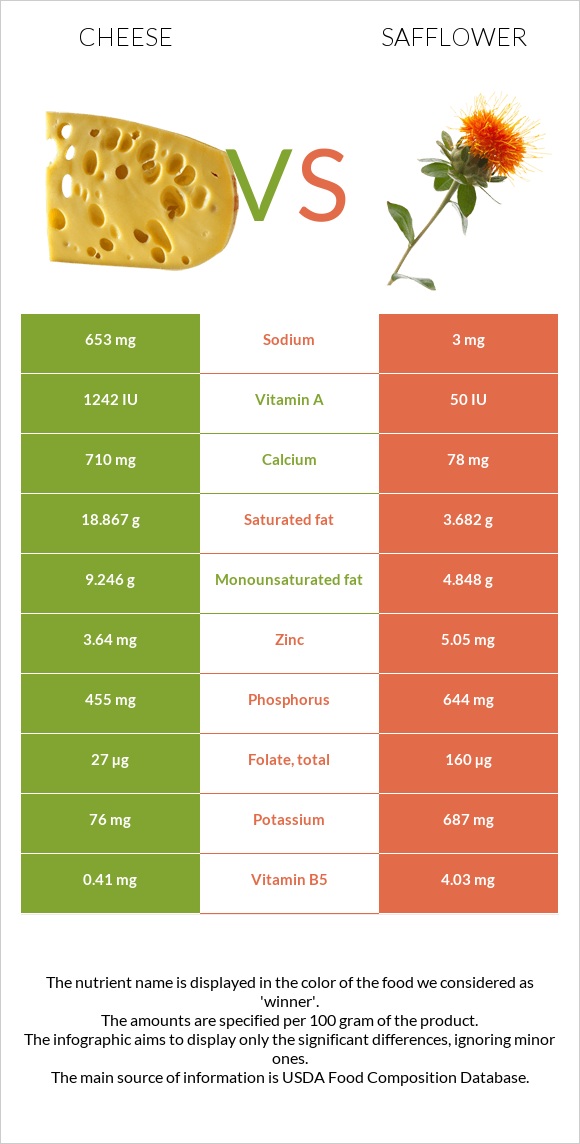
Significant differences between cheese and safflower Cheese has more calcium and vitamin B12; however, safflower is richer in copper, vitamin B1, manganese, vitamin B6, magnesium, vitamin B5, and iron. Safflower covers your daily copper needs 191% more than cheese. Safflower contains less saturated fat. Specific food types used in this comparison are Cheese, cheddar and Seeds, safflower seed kernels, dried .
Infographic
Mineral Comparison
Mineral comparison score is based on the number of minerals by which one or the other food is richer. The "coverage" charts below show how much of the daily needs can be covered by 300 grams of the food.
2
100 g
300 g
1 cubic inch - 17g 1 slice (1 oz) - 28g 1 oz - 28.35g 1 cup, shredded - 113g 1 cup, diced - 132g 1 cup, melted - 244g
Magnesium
Magnesium
Calcium
Calcium
Potassium
Potassium
Iron
Iron
Copper
Copper
Zinc
Zinc
Phosphorus
Phosphorus
Sodium
Sodium
Manganese
Manganese
Selenium
Selenium
19%
213%
6.7%
5.3%
10%
99%
195%
85%
3.5%
155%
8
100 g
300 g
1 oz - 28.35g
Magnesium
Magnesium
Calcium
Calcium
Potassium
Potassium
Iron
Iron
Copper
Copper
Zinc
Zinc
Phosphorus
Phosphorus
Sodium
Sodium
Manganese
Manganese
Selenium
Selenium
252%
23%
61%
184%
582%
138%
276%
0.39%
263%
0%
Vitamin Comparison
Vitamin comparison score is based on the number of vitamins by which one or the other food is richer. The "coverage" charts below show how much of the daily needs can be covered by 300 grams of the food.
5
100 g
300 g
1 cubic inch - 17g 1 slice (1 oz) - 28g 1 oz - 28.35g 1 cup, shredded - 113g 1 cup, diced - 132g 1 cup, melted - 244g
Vitamin C
Vit. C
Vitamin D
Vit. D
Vitamin A
Vit. A
Vitamin E
Vit. E
Vitamin B1
Vit. B1
Vitamin B2
Vit. B2
Vitamin B3
Vit. B3
Vitamin B5
Vit. B5
Vitamin B6
Vit. B6
Vitamin B12
Vit. B12
Vitamin K
Vit. K
Folate
Folate
0%
9%
110%
14%
7.3%
99%
1.1%
25%
15%
138%
6%
20%
5
100 g
300 g
1 oz - 28.35g
Vitamin C
Vit. C
Vitamin D
Vit. D
Vitamin A
Vit. A
Vitamin E
Vit. E
Vitamin B1
Vit. B1
Vitamin B2
Vit. B2
Vitamin B3
Vit. B3
Vitamin B5
Vit. B5
Vitamin B6
Vit. B6
Vitamin B12
Vit. B12
Vitamin K
Vit. K
Folate
Folate
0%
0%
1%
0%
291%
96%
43%
242%
270%
0%
0%
120%
All nutrients comparison - raw data values
Nutrient
DV% diff.
Copper
0.03mg
1.747mg
191%
Polyunsaturated fat
1.421g
28.223g
179%
Vitamin B1
0.029mg
1.163mg
95%
Manganese
0.027mg
2.014mg
86%
Vitamin B6
0.066mg
1.17mg
85%
Magnesium
27mg
353mg
78%
Vitamin B5
0.41mg
4.03mg
72%
Saturated fat
18.867g
3.682g
69%
Calcium
710mg
78mg
63%
Iron
0.14mg
4.9mg
60%
Selenium
28.5µg
52%
Vitamin B12
1.1µg
0µg
46%
Vitamin A
330µg
3µg
36%
Cholesterol
99mg
0mg
33%
Folate
27µg
160µg
33%
Sodium
653mg
3mg
28%
Phosphorus
455mg
644mg
27%
Potassium
76mg
687mg
18%
Vitamin B3
0.059mg
2.284mg
14%
Protein
22.87g
16.18g
13%
Zinc
3.64mg
5.05mg
13%
Monounsaturated fat
9.246g
4.848g
11%
Carbs
3.09g
34.29g
10%
Fats
33.31g
38.45g
8%
Calories
404kcal
517kcal
6%
Vitamin E
0.71mg
5%
Vitamin D*
24 IU
0 IU
3%
Vitamin D
0.6µg
0µg
3%
Choline
16.5mg
3%
Vitamin K
2.4µg
2%
Vitamin B2
0.428mg
0.415mg
1%
Protein per 100 calories
5.7g
3.1g
N/A
Calories per 10 g protein
177kcal
320kcal
N/A
Weight per 100 calories
25g
19g
N/A
Unsaturated / Saturated Fat ratio
0.57
9
N/A
Net carbs
3.09g
34.29g
N/A
Sugar
0.48g
N/A
Trans fat
0.917g
N/A
Tryptophan
0.547mg
0.183mg
0%
Threonine
1.044mg
0.586mg
0%
Isoleucine
1.206mg
0.717mg
0%
Leucine
1.939mg
1.154mg
0%
Lysine
1.025mg
0.534mg
0%
Methionine
0.547mg
0.284mg
0%
Phenylalanine
1.074mg
0.806mg
0%
Valine
1.404mg
1.025mg
0%
Histidine
0.547mg
0.452mg
0%
Omega-3 - EPA
0.01g
N/A
Omega-3 - DHA
0.001g
N/A
Omega-3 - DPA
0.017g
N/A
Omega-6 - Eicosadienoic acid
0.007g
N/A
Macronutrient Comparison
Macronutrient breakdown side-by-side comparison
2
23%
33%
3%
37%
4%
Protein:
22.87 g
Fats:
33.31 g
Carbs:
3.09 g
Water:
37.02 g
Other:
3.71 g
3
16%
38%
34%
6%
5%
Protein:
16.18 g
Fats:
38.45 g
Carbs:
34.29 g
Water:
5.62 g
Other:
5.46 g
Contains
more
Protein Protein
+41.3%
Contains
more
Water Water
+558.7%
Contains
more
Fats Fats
+15.4%
Contains
more
Carbs Carbs
+1009.7%
Contains
more
Other Other
+47.2%
Fat Type Comparison
Fat type breakdown side-by-side comparison
1
64%
31%
5%
Saturated fat:
Sat. Fat
18.867 g
Monounsaturated fat:
Mono. Fat
9.246 g
Polyunsaturated fat:
Poly. Fat
1.421 g
2
10%
13%
77%
Saturated fat:
Sat. Fat
3.682 g
Monounsaturated fat:
Mono. Fat
4.848 g
Polyunsaturated fat:
Poly. Fat
28.223 g
Contains
more
Mono. Fat Monounsaturated fat
+90.7%
Contains
less
Sat. Fat Saturated fat
-80.5%
Contains
more
Poly. Fat Polyunsaturated fat
+1886.1%