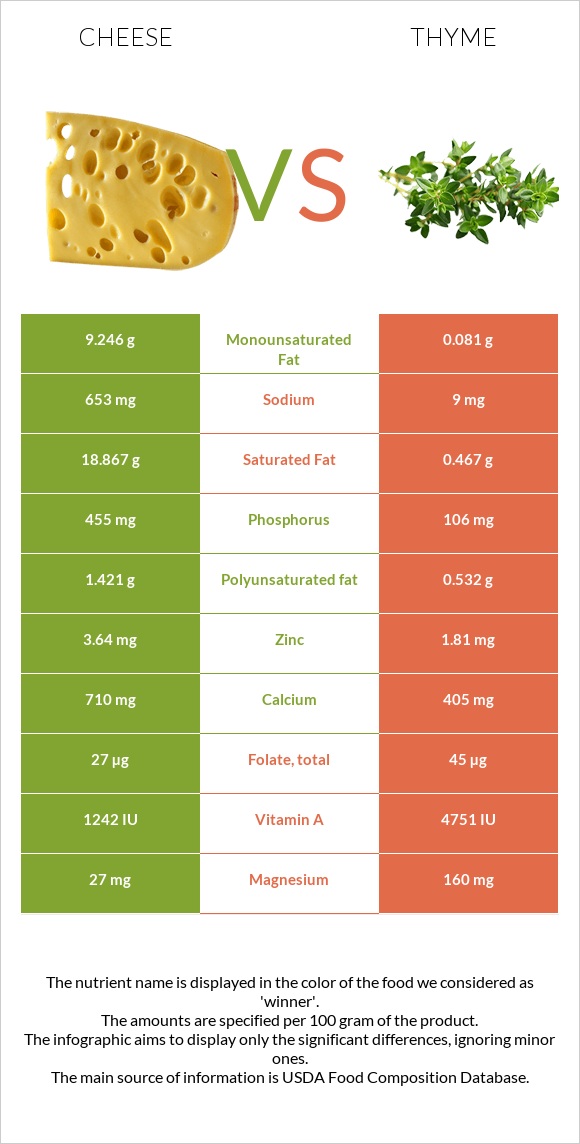
How are cheese and thyme different? Cheese has more phosphorus and vitamin B12; however, thyme is richer in iron, vitamin C, manganese, vitamin A, copper, and fiber. Thyme covers your daily need for iron, 216% more than cheese. Thyme contains less cholesterol. Thyme has a higher glycemic index. The glycemic index of thyme is 45, while the glycemic index of cheese is 0. Cheese, cheddar and Thyme, fresh types were used in this article.
Infographic
Mineral Comparison
Mineral comparison score is based on the number of minerals by which one or the other food is richer. The "coverage" charts below show how much of the daily needs can be covered by 300 grams of the food.
4
100 g
300 g
1 cubic inch - 17g 1 slice (1 oz) - 28g 1 oz - 28.35g 1 cup, shredded - 113g 1 cup, diced - 132g 1 cup, melted - 244g
Magnesium
Magnesium
Calcium
Calcium
Potassium
Potassium
Iron
Iron
Copper
Copper
Zinc
Zinc
Phosphorus
Phosphorus
Sodium
Sodium
Manganese
Manganese
Selenium
Selenium
19%
213%
6.7%
5.3%
10%
99%
195%
85%
3.5%
155%
6
100 g
300 g
0.5 tsp - 0.4g 1 tsp - 0.8g
Magnesium
Magnesium
Calcium
Calcium
Potassium
Potassium
Iron
Iron
Copper
Copper
Zinc
Zinc
Phosphorus
Phosphorus
Sodium
Sodium
Manganese
Manganese
Selenium
Selenium
114%
122%
54%
654%
185%
49%
45%
1.2%
224%
0%
Vitamin Comparison
Vitamin comparison score is based on the number of vitamins by which one or the other food is richer. The "coverage" charts below show how much of the daily needs can be covered by 300 grams of the food.
5
100 g
300 g
1 cubic inch - 17g 1 slice (1 oz) - 28g 1 oz - 28.35g 1 cup, shredded - 113g 1 cup, diced - 132g 1 cup, melted - 244g
Vitamin C
Vit. C
Vitamin D
Vit. D
Vitamin A
Vit. A
Vitamin E
Vit. E
Vitamin B1
Vit. B1
Vitamin B2
Vit. B2
Vitamin B3
Vit. B3
Vitamin B5
Vit. B5
Vitamin B6
Vit. B6
Vitamin B12
Vit. B12
Vitamin K
Vit. K
Folate
Folate
0%
9%
110%
14%
7.3%
99%
1.1%
25%
15%
138%
6%
20%
5
100 g
300 g
0.5 tsp - 0.4g 1 tsp - 0.8g
Vitamin C
Vit. C
Vitamin D
Vit. D
Vitamin A
Vit. A
Vitamin E
Vit. E
Vitamin B1
Vit. B1
Vitamin B2
Vit. B2
Vitamin B3
Vit. B3
Vitamin B5
Vit. B5
Vitamin B6
Vit. B6
Vitamin B12
Vit. B12
Vitamin K
Vit. K
Folate
Folate
534%
0%
79%
0%
12%
109%
34%
25%
80%
0%
0%
34%
All nutrients comparison - raw data values
Nutrient
DV% diff.
Iron
0.14mg
17.45mg
216%
Vitamin C
0mg
160.1mg
178%
Saturated fat
18.867g
0.467g
84%
Manganese
0.027mg
1.719mg
74%
Copper
0.03mg
0.555mg
58%
Fiber
0g
14g
56%
Selenium
28.5µg
52%
Phosphorus
455mg
106mg
50%
Fats
33.31g
1.68g
49%
Vitamin B12
1.1µg
0µg
46%
Protein
22.87g
5.56g
35%
Cholesterol
99mg
0mg
33%
Magnesium
27mg
160mg
32%
Calcium
710mg
405mg
31%
Sodium
653mg
9mg
28%
Monounsaturated fat
9.246g
0.081g
23%
Vitamin B6
0.066mg
0.348mg
22%
Zinc
3.64mg
1.81mg
17%
Potassium
76mg
609mg
16%
Calories
404kcal
101kcal
15%
Vitamin B3
0.059mg
1.824mg
11%
Vitamin A
330µg
238µg
10%
Carbs
3.09g
24.45g
7%
Polyunsaturated fat
1.421g
0.532g
6%
Vitamin E
0.71mg
5%
Folate
27µg
45µg
5%
Vitamin D*
24 IU
0 IU
3%
Vitamin D
0.6µg
0µg
3%
Vitamin B2
0.428mg
0.471mg
3%
Choline
16.5mg
3%
Vitamin B1
0.029mg
0.048mg
2%
Vitamin K
2.4µg
2%
Protein per 100 calories
5.7g
5.5g
N/A
Calories per 10 g protein
177kcal
182kcal
N/A
Weight per 100 calories
25g
99g
N/A
Unsaturated / Saturated Fat ratio
0.57
1.3
N/A
Net carbs
3.09g
10.45g
N/A
Sugar
0.48g
N/A
Vitamin B5
0.41mg
0.409mg
0%
Trans fat
0.917g
0g
N/A
Tryptophan
0.547mg
0.114mg
0%
Threonine
1.044mg
0.154mg
0%
Isoleucine
1.206mg
0.285mg
0%
Leucine
1.939mg
0.262mg
0%
Lysine
1.025mg
0.126mg
0%
Methionine
0.547mg
0%
Phenylalanine
1.074mg
0%
Valine
1.404mg
0.307mg
0%
Histidine
0.547mg
0%
Omega-3 - EPA
0.01g
N/A
Omega-3 - DHA
0.001g
N/A
Omega-3 - DPA
0.017g
N/A
Omega-6 - Eicosadienoic acid
0.007g
N/A
Macronutrient Comparison
Macronutrient breakdown side-by-side comparison
3
23%
33%
3%
37%
4%
Protein:
22.87 g
Fats:
33.31 g
Carbs:
3.09 g
Water:
37.02 g
Other:
3.71 g
2
6%
2%
24%
65%
3%
Protein:
5.56 g
Fats:
1.68 g
Carbs:
24.45 g
Water:
65.11 g
Other:
3.2 g
Contains
more
Protein Protein
+311.3%
Contains
more
Fats Fats
+1882.7%
Contains
more
Other Other
+15.9%
Contains
more
Carbs Carbs
+691.3%
Contains
more
Water Water
+75.9%
Fat Type Comparison
Fat type breakdown side-by-side comparison
2
64%
31%
5%
Saturated fat:
Sat. Fat
18.867 g
Monounsaturated fat:
Mono. Fat
9.246 g
Polyunsaturated fat:
Poly. Fat
1.421 g
1
43%
8%
49%
Saturated fat:
Sat. Fat
0.467 g
Monounsaturated fat:
Mono. Fat
0.081 g
Polyunsaturated fat:
Poly. Fat
0.532 g
Contains
more
Mono. Fat Monounsaturated fat
+11314.8%
Contains
more
Poly. Fat Polyunsaturated fat
+167.1%
Contains
less
Sat. Fat Saturated fat
-97.5%