Significant differences between coconut and biscuits Coconut has more manganese, copper, and fiber; however, biscuits are richer in vitamin B1, vitamin B2, calcium, selenium, and vitamin B3. Coconut covers your daily saturated fat needs 127% more than biscuits. Biscuits have 6 times less fiber than coconut. Coconut has 9g of fiber, while biscuits have 1.5g. Biscuits contain less saturated fat. Coconut has a higher glycemic index. The glycemic index of coconut is 59, while the glycemic index of biscuits is 44. Specific food types used in this comparison are Nuts, coconut meat, raw and Biscuits, plain or buttermilk, prepared from recipe .
Infographic
Mineral Comparison
Mineral comparison score is based on the number of minerals by which one or the other food is richer. The "coverage" charts below show how much of the daily needs can be covered by 300 grams of the food.
6
100 g
300 g
1 piece (2" x 2" x 1/2") - 45g 1 cup, shredded - 80g 1 medium - 397g
Magnesium
Magnesium
Calcium
Calcium
Potassium
Potassium
Iron
Iron
Copper
Copper
Zinc
Zinc
Phosphorus
Phosphorus
Sodium
Sodium
Manganese
Manganese
Selenium
Selenium
23%
4.2%
31%
91%
145%
30%
48%
2.6%
196%
55%
4
100 g
300 g
1 small (1-1/2" dia) - 14g 1 oz - 28.35g 1 biscuit (2-1/2" dia) - 60g 1 biscuit (4" dia) - 101g
Magnesium
Magnesium
Calcium
Calcium
Potassium
Potassium
Iron
Iron
Copper
Copper
Zinc
Zinc
Phosphorus
Phosphorus
Sodium
Sodium
Manganese
Manganese
Selenium
Selenium
13%
71%
11%
109%
27%
15%
70%
76%
49%
106%
Vitamin Comparison
Vitamin comparison score is based on the number of vitamins by which one or the other food is richer. The "coverage" charts below show how much of the daily needs can be covered by 300 grams of the food.
4
100 g
300 g
1 piece (2" x 2" x 1/2") - 45g 1 cup, shredded - 80g 1 medium - 397g
Vitamin C
Vit. C
Vitamin D
Vit. D
Vitamin A
Vit. A
Vitamin E
Vit. E
Vitamin B1
Vit. B1
Vitamin B2
Vit. B2
Vitamin B3
Vit. B3
Vitamin B5
Vit. B5
Vitamin B6
Vit. B6
Vitamin B12
Vit. B12
Vitamin K
Vit. K
Folate
Folate
11%
0%
0%
4.8%
17%
4.6%
10%
18%
12%
0%
0.5%
20%
5
100 g
300 g
1 small (1-1/2" dia) - 14g 1 oz - 28.35g 1 biscuit (2-1/2" dia) - 60g 1 biscuit (4" dia) - 101g
Vitamin C
Vit. C
Vitamin D
Vit. D
Vitamin A
Vit. A
Vitamin E
Vit. E
Vitamin B1
Vit. B1
Vitamin B2
Vit. B2
Vitamin B3
Vit. B3
Vitamin B5
Vit. B5
Vitamin B6
Vit. B6
Vitamin B12
Vit. B12
Vitamin K
Vit. K
Folate
Folate
0.67%
0%
0%
0%
89%
72%
55%
17%
8.1%
10%
0%
46%
All nutrients comparison - raw data values
Nutrient
DV% diff.
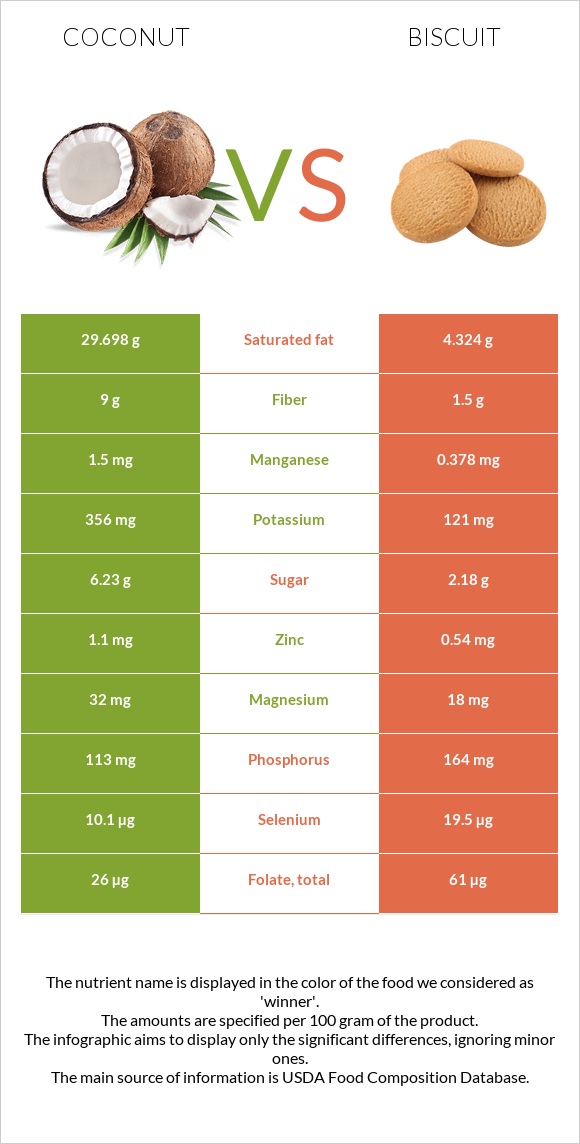
Saturated fat
29.698g
4.324g
115%
Manganese
1.5mg
0.378mg
49%
Copper
0.435mg
0.082mg
39%
Fiber
9g
1.5g
30%
Fats
33.49g
16.3g
26%
Polyunsaturated fat
0.366g
4.163g
25%
Sodium
20mg
580mg
24%
Vitamin B1
0.066mg
0.356mg
24%
Calcium
14mg
235mg
22%
Vitamin B2
0.02mg
0.31mg
22%
Selenium
10.1µg
19.5µg
17%
Vitamin B3
0.54mg
2.949mg
15%
Monounsaturated fat
1.425g
6.93g
14%
Carbs
15.23g
44.6g
10%
Folate
26µg
61µg
9%
Protein
3.33g
7g
7%
Potassium
356mg
121mg
7%
Phosphorus
113mg
164mg
7%
Iron
2.43mg
2.9mg
6%
Zinc
1.1mg
0.54mg
5%
Vitamin C
3.3mg
0.2mg
3%
Magnesium
32mg
18mg
3%
Vitamin B12
0µg
0.08µg
3%
Vitamin E
0.24mg
2%
Choline
12.1mg
2%
Cholesterol
0mg
3mg
1%
Vitamin B6
0.054mg
0.035mg
1%
Calories
354kcal
353kcal
0%
Protein per 100 calories
0.94g
2g
N/A
Calories per 10 g protein
1063kcal
504kcal
N/A
Weight per 100 calories
28g
28g
N/A
Unsaturated / Saturated Fat ratio
0.06
2.6
N/A
Net carbs
6.23g
43.1g
N/A
Sugar
6.23g
2.18g
N/A
Vitamin B5
0.3mg
0.285mg
0%
Vitamin K
0.2µg
0%
Tryptophan
0.039mg
0.087mg
0%
Threonine
0.121mg
0.211mg
0%
Isoleucine
0.131mg
0.273mg
0%
Leucine
0.247mg
0.514mg
0%
Lysine
0.147mg
0.226mg
0%
Methionine
0.062mg
0.132mg
0%
Phenylalanine
0.169mg
0.347mg
0%
Valine
0.202mg
0.313mg
0%
Histidine
0.077mg
0.161mg
0%
Macronutrient Comparison
Macronutrient breakdown side-by-side comparison
2
3%
33%
15%
47%
Protein:
3.33 g
Fats:
33.49 g
Carbs:
15.23 g
Water:
46.99 g
Other:
0.96 g
3
7%
16%
45%
29%
3%
Protein:
7 g
Fats:
16.3 g
Carbs:
44.6 g
Water:
28.9 g
Other:
3.2 g
Contains
more
Fats Fats
+105.5%
Contains
more
Water Water
+62.6%
Contains
more
Protein Protein
+110.2%
Contains
more
Carbs Carbs
+192.8%
Contains
more
Other Other
+233.3%
Fat Type Comparison
Fat type breakdown side-by-side comparison
0
94%
5%
Saturated fat:
Sat. Fat
29.698 g
Monounsaturated fat:
Mono. Fat
1.425 g
Polyunsaturated fat:
Poly. Fat
0.366 g
3
28%
45%
27%
Saturated fat:
Sat. Fat
4.324 g
Monounsaturated fat:
Mono. Fat
6.93 g
Polyunsaturated fat:
Poly. Fat
4.163 g
Contains
less
Sat. Fat Saturated fat
-85.4%
Contains
more
Mono. Fat Monounsaturated fat
+386.3%
Contains
more
Poly. Fat Polyunsaturated fat
+1037.4%