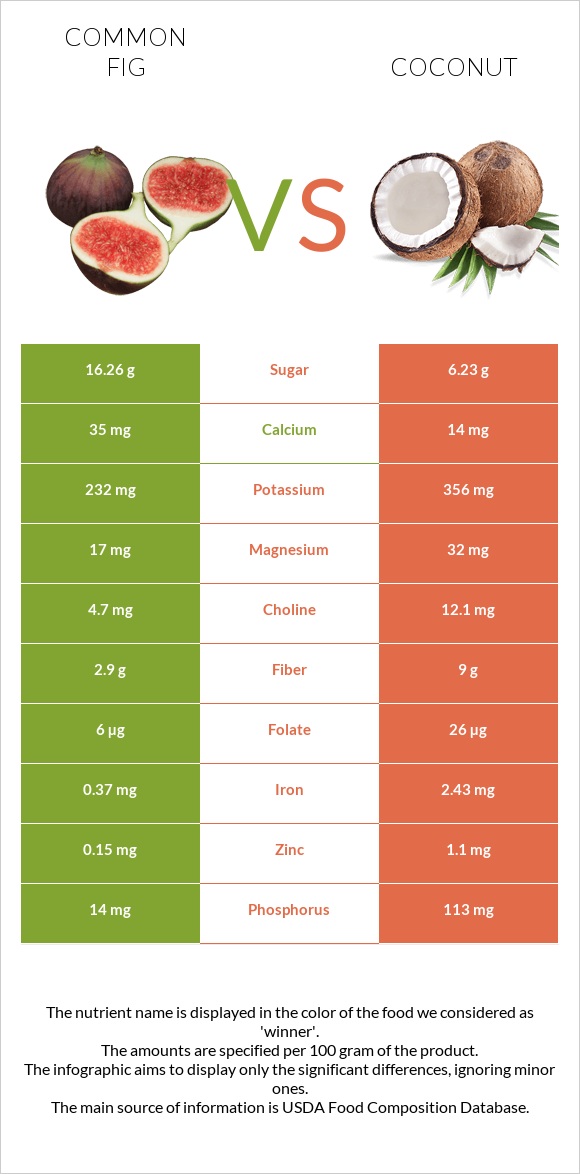
Summary of differences between figs and coconut Figs have less manganese, copper, iron, fiber, selenium, phosphorus, and zinc than coconut. Coconut covers your daily need for saturated fat, 148% more than figs. Figs have less saturated fat. These are the specific foods used in this comparison Figs, raw and Nuts, coconut meat, raw .
Infographic
Mineral Comparison
Mineral comparison score is based on the number of minerals by which one or the other food is richer. The "coverage" charts below show how much of the daily needs can be covered by 300 grams of the food.
2
100 g
300 g
1 small (1-1/2" dia) - 40g 1 medium (2-1/4" dia) - 50g 1 large (2-1/2" dia) - 64g
Magnesium
Magnesium
Calcium
Calcium
Potassium
Potassium
Iron
Iron
Copper
Copper
Zinc
Zinc
Phosphorus
Phosphorus
Sodium
Sodium
Manganese
Manganese
Selenium
Selenium
12%
11%
20%
14%
23%
4.1%
6%
0.13%
17%
1.1%
8
100 g
300 g
1 piece (2" x 2" x 1/2") - 45g 1 cup, shredded - 80g 1 medium - 397g
Magnesium
Magnesium
Calcium
Calcium
Potassium
Potassium
Iron
Iron
Copper
Copper
Zinc
Zinc
Phosphorus
Phosphorus
Sodium
Sodium
Manganese
Manganese
Selenium
Selenium
23%
4.2%
31%
91%
145%
30%
48%
2.6%
196%
55%
Vitamin Comparison
Vitamin comparison score is based on the number of vitamins by which one or the other food is richer. The "coverage" charts below show how much of the daily needs can be covered by 300 grams of the food.
4
100 g
300 g
1 small (1-1/2" dia) - 40g 1 medium (2-1/4" dia) - 50g 1 large (2-1/2" dia) - 64g
Vitamin C
Vit. C
Vitamin D
Vit. D
Vitamin A
Vit. A
Vitamin E
Vit. E
Vitamin B1
Vit. B1
Vitamin B2
Vit. B2
Vitamin B3
Vit. B3
Vitamin B5
Vit. B5
Vitamin B6
Vit. B6
Vitamin B12
Vit. B12
Vitamin K
Vit. K
Folate
Folate
6.7%
0%
2.3%
2.2%
15%
12%
7.5%
18%
26%
0%
12%
4.5%
4
100 g
300 g
1 piece (2" x 2" x 1/2") - 45g 1 cup, shredded - 80g 1 medium - 397g
Vitamin C
Vit. C
Vitamin D
Vit. D
Vitamin A
Vit. A
Vitamin E
Vit. E
Vitamin B1
Vit. B1
Vitamin B2
Vit. B2
Vitamin B3
Vit. B3
Vitamin B5
Vit. B5
Vitamin B6
Vit. B6
Vitamin B12
Vit. B12
Vitamin K
Vit. K
Folate
Folate
11%
0%
0%
4.8%
17%
4.6%
10%
18%
12%
0%
0.5%
20%
All nutrients comparison - raw data values
Nutrient
DV% diff.
Saturated fat
0.06g
29.698g
135%
Manganese
0.128mg
1.5mg
60%
Fats
0.3g
33.49g
51%
Copper
0.07mg
0.435mg
41%
Iron
0.37mg
2.43mg
26%
Fiber
2.9g
9g
24%
Selenium
0.2µg
10.1µg
18%
Calories
74kcal
354kcal
14%
Phosphorus
14mg
113mg
14%
Zinc
0.15mg
1.1mg
9%
Protein
0.75g
3.33g
5%
Vitamin B6
0.113mg
0.054mg
5%
Folate
6µg
26µg
5%
Magnesium
17mg
32mg
4%
Potassium
232mg
356mg
4%
Vitamin K
4.7µg
0.2µg
4%
Monounsaturated fat
0.066g
1.425g
3%
Calcium
35mg
14mg
2%
Vitamin B2
0.05mg
0.02mg
2%
Vitamin C
2mg
3.3mg
1%
Carbs
19.18g
15.23g
1%
Sodium
1mg
20mg
1%
Vitamin A
7µg
0µg
1%
Vitamin E
0.11mg
0.24mg
1%
Vitamin B1
0.06mg
0.066mg
1%
Vitamin B3
0.4mg
0.54mg
1%
Choline
4.7mg
12.1mg
1%
Polyunsaturated fat
0.144g
0.366g
1%
Protein per 100 calories
1g
0.94g
N/A
Calories per 10 g protein
987kcal
1063kcal
N/A
Weight per 100 calories
135g
28g
N/A
Unsaturated / Saturated Fat ratio
3.5
0.06
N/A
Net carbs
16.28g
6.23g
N/A
Sugar
16.26g
6.23g
N/A
Vitamin B5
0.3mg
0.3mg
0%
Tryptophan
0.006mg
0.039mg
0%
Threonine
0.024mg
0.121mg
0%
Isoleucine
0.023mg
0.131mg
0%
Leucine
0.033mg
0.247mg
0%
Lysine
0.03mg
0.147mg
0%
Methionine
0.006mg
0.062mg
0%
Phenylalanine
0.018mg
0.169mg
0%
Valine
0.028mg
0.202mg
0%
Histidine
0.011mg
0.077mg
0%
Macronutrient Comparison
Macronutrient breakdown side-by-side comparison
2
19%
79%
Protein:
0.75 g
Fats:
0.3 g
Carbs:
19.18 g
Water:
79.11 g
Other:
0.66 g
3
3%
33%
15%
47%
Protein:
3.33 g
Fats:
33.49 g
Carbs:
15.23 g
Water:
46.99 g
Other:
0.96 g
Contains
more
Carbs Carbs
+25.9%
Contains
more
Water Water
+68.4%
Contains
more
Protein Protein
+344%
Contains
more
Fats Fats
+11063.3%
Contains
more
Other Other
+45.5%
Fat Type Comparison
Fat type breakdown side-by-side comparison
1
22%
24%
53%
Saturated fat:
Sat. Fat
0.06 g
Monounsaturated fat:
Mono. Fat
0.066 g
Polyunsaturated fat:
Poly. Fat
0.144 g
2
94%
5%
Saturated fat:
Sat. Fat
29.698 g
Monounsaturated fat:
Mono. Fat
1.425 g
Polyunsaturated fat:
Poly. Fat
0.366 g
Contains
less
Sat. Fat Saturated fat
-99.8%
Contains
more
Mono. Fat Monounsaturated fat
+2059.1%
Contains
more
Poly. Fat Polyunsaturated fat
+154.2%