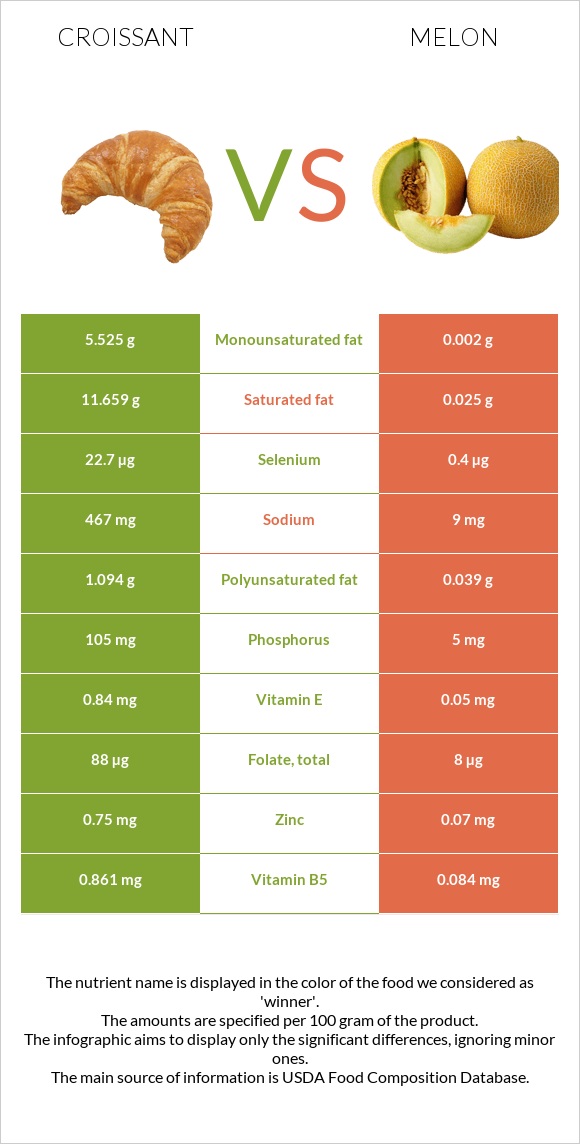
Important differences between croissant and melon Croissant has more selenium, vitamin B1, iron, folate, vitamin B2, and vitamin B5; however, melon has more vitamin C. Croissant's daily need coverage for saturated fat is 58% more. The food varieties used in the comparison are Croissants, butter and Melons, casaba, raw .
Infographic
Mineral Comparison
Mineral comparison score is based on the number of minerals by which one or the other food is richer. The "coverage" charts below show how much of the daily needs can be covered by 300 grams of the food.
8
100 g
300 g
1 croissant, mini - 28g 1 oz - 28.35g 1 croissant, small - 42g 1 croissant, medium - 57g 1 croissant, large - 67g
Magnesium
Magnesium
Calcium
Calcium
Potassium
Potassium
Iron
Iron
Copper
Copper
Zinc
Zinc
Phosphorus
Phosphorus
Sodium
Sodium
Manganese
Manganese
Selenium
Selenium
11%
11%
10%
76%
27%
20%
45%
61%
43%
124%
2
100 g
300 g
0.1 fruit - 164g 1 cup, cubes - 170g 1 melon - 1640g
Magnesium
Magnesium
Calcium
Calcium
Potassium
Potassium
Iron
Iron
Copper
Copper
Zinc
Zinc
Phosphorus
Phosphorus
Sodium
Sodium
Manganese
Manganese
Selenium
Selenium
7.9%
3.3%
16%
13%
20%
1.9%
2.1%
1.2%
4.6%
2.2%
Vitamin Comparison
Vitamin comparison score is based on the number of vitamins by which one or the other food is richer. The "coverage" charts below show how much of the daily needs can be covered by 300 grams of the food.
8
100 g
300 g
1 croissant, mini - 28g 1 oz - 28.35g 1 croissant, small - 42g 1 croissant, medium - 57g 1 croissant, large - 67g
Vitamin C
Vit. C
Vitamin D
Vit. D
Vitamin A
Vit. A
Vitamin E
Vit. E
Vitamin B1
Vit. B1
Vitamin B2
Vit. B2
Vitamin B3
Vit. B3
Vitamin B5
Vit. B5
Vitamin B6
Vit. B6
Vitamin B12
Vit. B12
Vitamin K
Vit. K
Folate
Folate
0.67%
0%
69%
17%
97%
56%
41%
52%
13%
20%
4.5%
66%
3
100 g
300 g
0.1 fruit - 164g 1 cup, cubes - 170g 1 melon - 1640g
Vitamin C
Vit. C
Vitamin D
Vit. D
Vitamin A
Vit. A
Vitamin E
Vit. E
Vitamin B1
Vit. B1
Vitamin B2
Vit. B2
Vitamin B3
Vit. B3
Vitamin B5
Vit. B5
Vitamin B6
Vit. B6
Vitamin B12
Vit. B12
Vitamin K
Vit. K
Folate
Folate
73%
0%
0%
1%
3.8%
7.2%
4.4%
5%
38%
0%
6.3%
6%
All nutrients comparison - raw data values
Nutrient
DV% diff.
Saturated fat
11.659g
0.025g
53%
Selenium
22.7µg
0.4µg
41%
Fats
21g
0.1g
32%
Vitamin B1
0.388mg
0.015mg
31%
Vitamin C
0.2mg
21.8mg
24%
Vitamin A
206µg
0µg
23%
Cholesterol
67mg
0mg
22%
Iron
2.03mg
0.34mg
21%
Sodium
467mg
9mg
20%
Folate
88µg
8µg
20%
Calories
406kcal
28kcal
19%
Vitamin B2
0.241mg
0.031mg
16%
Vitamin B5
0.861mg
0.084mg
16%
Protein
8.2g
1.11g
14%
Phosphorus
105mg
5mg
14%
Monounsaturated fat
5.525g
0.002g
14%
Carbs
45.8g
6.58g
13%
Manganese
0.33mg
0.035mg
13%
Vitamin B3
2.188mg
0.232mg
12%
Vitamin B6
0.058mg
0.163mg
8%
Fiber
2.6g
0.9g
7%
Vitamin B12
0.16µg
0µg
7%
Polyunsaturated fat
1.094g
0.039g
7%
Zinc
0.75mg
0.07mg
6%
Choline
38.8mg
7.6mg
6%
Vitamin E
0.84mg
0.05mg
5%
Calcium
37mg
11mg
3%
Potassium
118mg
182mg
2%
Copper
0.08mg
0.06mg
2%
Magnesium
16mg
11mg
1%
Vitamin K
1.8µg
2.5µg
1%
Protein per 100 calories
2g
4g
N/A
Calories per 10 g protein
495kcal
252kcal
N/A
Weight per 100 calories
25g
357g
N/A
Unsaturated / Saturated Fat ratio
0.57
1.6
N/A
Net carbs
43.2g
5.68g
N/A
Sugar
11.26g
5.69g
N/A
Tryptophan
0.099mg
0%
Threonine
0.284mg
0%
Isoleucine
0.365mg
0%
Leucine
0.623mg
0%
Lysine
0.329mg
0%
Methionine
0.175mg
0%
Phenylalanine
0.416mg
0%
Valine
0.41mg
0%
Histidine
0.187mg
0%
Omega-3 - EPA
0.003g
0g
N/A
Omega-3 - DHA
0.002g
0g
N/A
Macronutrient Comparison
Macronutrient breakdown side-by-side comparison
4
8%
21%
46%
23%
2%
Protein:
8.2 g
Fats:
21 g
Carbs:
45.8 g
Water:
23.2 g
Other:
1.8 g
1
7%
92%
Protein:
1.11 g
Fats:
0.1 g
Carbs:
6.58 g
Water:
91.85 g
Other:
0.36 g
Contains
more
Protein Protein
+638.7%
Contains
more
Fats Fats
+20900%
Contains
more
Carbs Carbs
+596%
Contains
more
Other Other
+400%
Contains
more
Water Water
+295.9%
Fat Type Comparison
Fat type breakdown side-by-side comparison
2
64%
30%
6%
Saturated fat:
Sat. Fat
11.659 g
Monounsaturated fat:
Mono. Fat
5.525 g
Polyunsaturated fat:
Poly. Fat
1.094 g
1
38%
3%
59%
Saturated fat:
Sat. Fat
0.025 g
Monounsaturated fat:
Mono. Fat
0.002 g
Polyunsaturated fat:
Poly. Fat
0.039 g
Contains
more
Mono. Fat Monounsaturated fat
+276150%
Contains
more
Poly. Fat Polyunsaturated fat
+2705.1%
Contains
less
Sat. Fat Saturated fat
-99.8%