Croissant vs. Danish Pastry — Health Impact and Nutrition Comparison


Summary
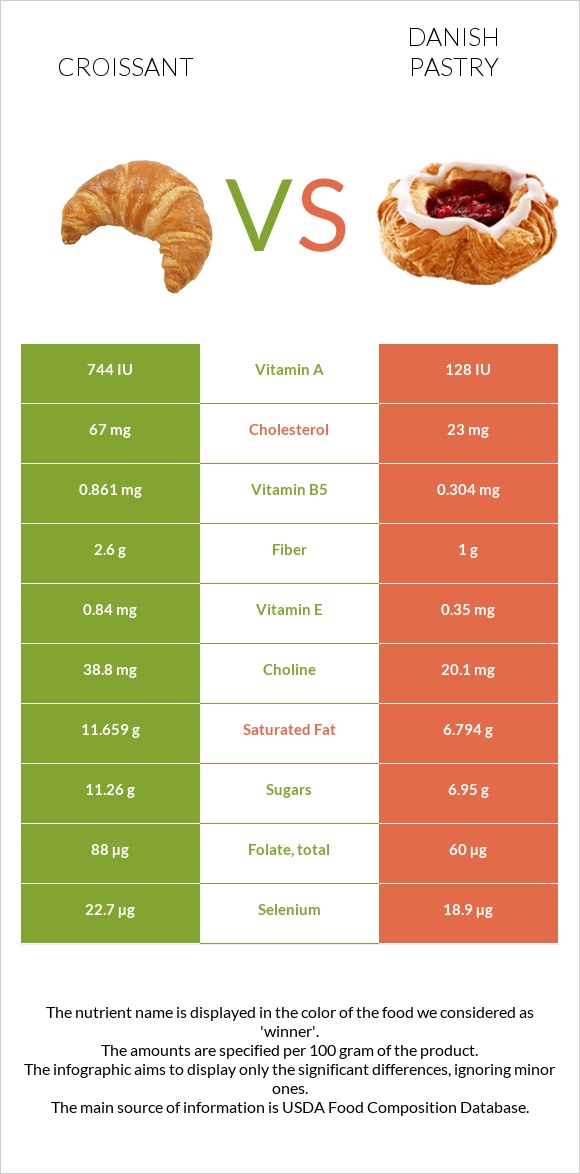
Although both croissants and Danish pastries use similar ingredients for the dough, traditional Danish pastries also incorporate eggs into the dough. Croissants provide around 3 times more cholesterol as well as slightly more carbs and calories when compared to Danish pastries.
Generally, croissants contain higher levels of various vitamins than Danish pastries. For instance, they provide 2 times more vitamins B1 and B5 and 5 times more vitamin A. However, the mineral contents in both pastries are quite similar.
Introduction
Croissants and Danish pastries are popular sweets of European origin. In this article, we will be comparing Croissants and Danish pastries while focusing on nutrition.
What's the Actual Difference?
Croissants and Danish pastries are both multilayered laminated pastries, but croissant dough is believed to produce even more layers when baked.
While both croissants and Danish pastries use similar ingredients and recipes to prepare the doughs, traditional Danish pastries also include eggs in the dough.
Different types of these pastries may have various fillings. Croissants and Danish pastries differ in their folding techniques: the former is letter-folded, while the latter is made using a book fold.
Nutrition
The nutritional differences here are depicted for butter croissants and cheese-filled Danish pastries.
The serving sizes for both are usually one piece. Depending on the size, the weight of the croissant will differ. On average, one medium-sized croissant is about 57 grams, while a large one weighs 67 grams. One Danish pastry weighs about 71 grams.
However, to keep the comparison between the two pastries simple, we will sometimes refer to 100-gram servings of each in this section.
Macronutrients and Calories
As can be seen from the macronutrient comparison charts below, Danish pastries and croissants have similar macronutrient compositions. The predominant macronutrients in both are carbs, which make up 46% of the entire macronutrient composition of croissants and 37% of the entire macronutrient composition of Danish pastries.
Macronutrient Comparison
Contains
more
CarbsCarbs
+23.1%
Contains
more
OtherOther
+20%
Contains
more
WaterWater
+35.3%
Calories
Both croissants and Danish pastries are high-calorie foods, but croissants provide slightly more calories than Danish pastries.
Per 100-gram serving, croissants provide 406 calories, while the same serving of Danish pastries provides 374 calories.
Fats
Croissants and Danish pastries have similar amounts of fats; however, they differ in the amount of saturated and unsaturated fats they contain.
Croissants are higher in saturated fats, while Danish pastries provide 2 times more monounsaturated and polyunsaturated fats.
Fat Type Comparison
Contains
less
Sat. FatSaturated fat
-41.7%
Contains
more
Mono. FatMonounsaturated fat
+104.8%
Contains
more
Poly. FatPolyunsaturated fat
+135.4%
Cholesterol
Croissant is 3 times richer in cholesterol when compared to Danish pastry.
Per 100-gram serving, Danish pastries provide 23mg of cholesterol, while croissants contain 67mg.
Carbohydrates
Croissants are slightly higher in carbs than Danish pastries. Per 100-gram serving, they contain 45.8g of carbs, while Danish pastries contain 37.2g.
Croissant is higher in sugar content. It also provides 2 times more fiber than Danish pastry.
Protein
Croissants and Danish pastries contain some proteins due to the ingredients they are prepared from. Croissant contains 0.2g more protein per 100g; hence, this difference is negligible.
Again, keep in mind that we are referring to butter croissants and cheese-filled Danish pastries; hence, the nutritional values presented above may change if we compare different fillings of these pastries.
Vitamins
Croissants have higher vitamin content than Danish pastries.
Croissants are more than 2 times richer in vitamins B1 and B5 and 5 times richer in vitamin A compared to Danish pastries. They also contain higher amounts of folate.
Danish pastries provide slightly more amounts of vitamin K and vitamin B12. Both croissants and Danish pastries also contain similar amounts of vitamin B2 and vitamin B3.
Vitamin Comparison
Contains
more
Vitamin CVitamin C
+100%
Contains
more
Vitamin AVitamin A
+488.6%
Contains
more
Vitamin EVitamin E
+140%
Contains
more
Vitamin B1Vitamin B1
+104.2%
Contains
more
Vitamin B5Vitamin B5
+183.2%
Contains
more
Vitamin B6Vitamin B6
+45%
Contains
more
FolateFolate
+46.7%
Contains
more
Vitamin B12Vitamin B12
+25%
Contains
more
Vitamin KVitamin K
+283.3%
Minerals
The mineral composition of these two pastries is quite similar. The predominant minerals found in both are selenium, iron, phosphorus, sodium, and manganese.
They both contain similar amounts of calcium, magnesium, phosphorus, zinc, and manganese. Croissants are slightly higher in iron and potassium, while Danish pastries are slightly higher in sodium and copper.
Mineral Comparison
Contains
more
PotassiumPotassium
+20.4%
Contains
more
IronIron
+12.8%
Contains
more
SeleniumSelenium
+20.1%
Contains
more
CopperCopper
+11.3%
Contains
less
SodiumSodium
-10.7%
Glycemic Index
Both croissants and Danish pastries are considered to have a medium glycemic index value. However, the glycemic index of croissants (56) is slightly higher than the glycemic index of Danish pastries (50).
You can check the GI values for the other foods by visiting our glycemic index chart.
Acidity
One way to understand the acidity of foods is through their potential renal acid load (PRAL) value, which shows how much acid or base the given food produces inside the organism.
Based on our calculations, the PRAL values of croissants and Danish pastries are 4.5 and 5, respectively, meaning both values are acidic.
Health Impact
Cardiovascular Health
Croissants and Danish pastries are considered to be processed food products. They can contain trans fats and saturated fats that increase the amounts of LDL cholesterol, causing a higher risk of heart disease and stroke (1, 2, 3).
Both croissants and Danish pastries are made with refined flour, which has a high glycemic index. Consuming these pastries in large amounts can contribute to insulin resistance, obesity, and cardiovascular disease (CVD).
It is important to consume them in moderation and occasionally to minimize their impact on CVD risk. Opting for healthier alternatives or homemade versions with less sugar and fat can be beneficial for those concerned about their heart health.
References

Infographic
All nutrients comparison - raw data values
| Nutrient | |
|
DV% diff. |
| Saturated fat | 11.659g | 6.794g | 22% |
| Vitamin A | 206µg | 35µg | 19% |
| Vitamin B1 | 0.388mg | 0.19mg | 17% |
| Cholesterol | 67mg | 23mg | 15% |
| Monounsaturated fat | 5.525g | 11.313g | 14% |
| Vitamin B5 | 0.861mg | 0.304mg | 11% |
| Polyunsaturated fat | 1.094g | 2.575g | 10% |
| Selenium | 22.7µg | 18.9µg | 7% |
| Folate | 88µg | 60µg | 7% |
| Fiber | 2.6g | 1g | 6% |
| Vitamin K | 1.8µg | 6.9µg | 4% |
| Carbs | 45.8g | 37.2g | 3% |
| Iron | 2.03mg | 1.8mg | 3% |
| Vitamin E | 0.84mg | 0.35mg | 3% |
| Choline | 38.8mg | 20.1mg | 3% |
| Calories | 406kcal | 374kcal | 2% |
| Sodium | 467mg | 417mg | 2% |
| Vitamin B12 | 0.16µg | 0.2µg | 2% |
| Fats | 21g | 21.9g | 1% |
| Potassium | 118mg | 98mg | 1% |
| Copper | 0.08mg | 0.089mg | 1% |
| Manganese | 0.33mg | 0.351mg | 1% |
| Vitamin B2 | 0.241mg | 0.26mg | 1% |
| Vitamin B3 | 2.188mg | 2mg | 1% |
| Vitamin B6 | 0.058mg | 0.04mg | 1% |
| Protein | 8.2g | 8g | 0% |
| Protein per 100 calories | 2g | 2.1g | N/A |
| Calories per 10 g protein | 495kcal | 468kcal | N/A |
| Weight per 100 calories | 25g | 27g | N/A |
| Unsaturated / Saturated Fat ratio | 0.57 | 2 | N/A |
| Vitamin C | 0.2mg | 0.1mg | 0% |
| Net carbs | 43.2g | 36.2g | N/A |
| Vitamin D* | 0 IU | 2 IU | 0% |
| Magnesium | 16mg | 15mg | 0% |
| Calcium | 37mg | 35mg | 0% |
| Sugar | 11.26g | 6.95g | N/A |
| Zinc | 0.75mg | 0.7mg | 0% |
| Phosphorus | 105mg | 108mg | 0% |
| Tryptophan | 0.099mg | 0.089mg | 0% |
| Threonine | 0.284mg | 0.293mg | 0% |
| Isoleucine | 0.365mg | 0.371mg | 0% |
| Leucine | 0.623mg | 0.644mg | 0% |
| Lysine | 0.329mg | 0.43mg | 0% |
| Methionine | 0.175mg | 0.174mg | 0% |
| Phenylalanine | 0.416mg | 0.402mg | 0% |
| Valine | 0.41mg | 0.412mg | 0% |
| Histidine | 0.187mg | 0.205mg | 0% |
| Omega-3 - EPA | 0.003g | 0g | N/A |
| Omega-3 - DHA | 0.002g | 0.001g | N/A |
People also compare


References
All the values for which the sources are not specified explicitly are taken from FDA’s Food Central. The exact link to the food presented on this page can be found below.
- Croissant - https://fdc.nal.usda.gov/fdc-app.html#/food-details/174987/nutrients
- Danish pastry - https://fdc.nal.usda.gov/fdc-app.html#/food-details/172754/nutrients
All the Daily Values are presented for males aged 31-50, for 2000-calorie diets.