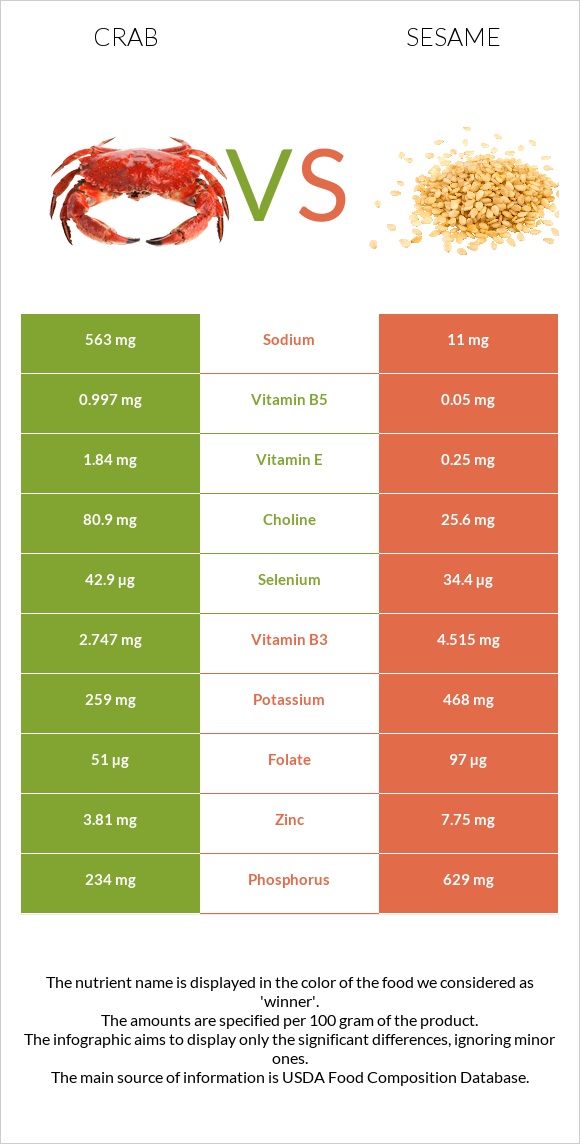
The main differences between crab and sesame Crab has more vitamin B12; however, sesame has more copper, iron, manganese, calcium, magnesium, vitamin B1, phosphorus, vitamin B6, and fiber. Daily need coverage for copper for sesame is 363% higher. Food types used in this article are Crustaceans, crab, blue, canned and Seeds, sesame seeds, whole, dried .
Infographic
Mineral Comparison
Mineral comparison score is based on the number of minerals by which one or the other food is richer. The "coverage" charts below show how much of the daily needs can be covered by 300 grams of the food.
1
100 g
300 g
1 oz - 28.35g 3 oz - 85g 1 can (6.5 oz), drained - 125g 1 cup - 135g
Magnesium
Magnesium
Calcium
Calcium
Potassium
Potassium
Iron
Iron
Copper
Copper
Zinc
Zinc
Phosphorus
Phosphorus
Sodium
Sodium
Manganese
Manganese
Selenium
Selenium
26%
27%
23%
19%
271%
104%
100%
73%
9.7%
234%
9
100 g
300 g
1 tbsp - 9g 1 cup - 144g
Magnesium
Magnesium
Calcium
Calcium
Potassium
Potassium
Iron
Iron
Copper
Copper
Zinc
Zinc
Phosphorus
Phosphorus
Sodium
Sodium
Manganese
Manganese
Selenium
Selenium
251%
293%
41%
546%
1361%
211%
270%
1.4%
321%
188%
Vitamin Comparison
Vitamin comparison score is based on the number of vitamins by which one or the other food is richer. The "coverage" charts below show how much of the daily needs can be covered by 300 grams of the food.
6
100 g
300 g
1 oz - 28.35g 3 oz - 85g 1 can (6.5 oz), drained - 125g 1 cup - 135g
Vitamin C
Vit. C
Vitamin D
Vit. D
Vitamin A
Vit. A
Vitamin E
Vit. E
Vitamin B1
Vit. B1
Vitamin B2
Vit. B2
Vitamin B3
Vit. B3
Vitamin B5
Vit. B5
Vitamin B6
Vit. B6
Vitamin B12
Vit. B12
Vitamin K
Vit. K
Folate
Folate
11%
0%
0.33%
37%
5.8%
21%
52%
60%
36%
416%
0.75%
38%
5
100 g
300 g
1 tbsp - 9g 1 cup - 144g
Vitamin C
Vit. C
Vitamin D
Vit. D
Vitamin A
Vit. A
Vitamin E
Vit. E
Vitamin B1
Vit. B1
Vitamin B2
Vit. B2
Vitamin B3
Vit. B3
Vitamin B5
Vit. B5
Vitamin B6
Vit. B6
Vitamin B12
Vit. B12
Vitamin K
Vit. K
Folate
Folate
0%
0%
0%
5%
198%
57%
85%
3%
182%
0%
0%
73%
All nutrients comparison - raw data values
Nutrient
DV% diff.
Copper
0.814mg
4.082mg
363%
Iron
0.5mg
14.55mg
176%
Polyunsaturated fat
0.258g
21.773g
143%
Vitamin B12
3.33µg
0µg
139%
Manganese
0.074mg
2.46mg
104%
Calcium
91mg
975mg
88%
Fats
0.74g
49.67g
75%
Magnesium
36mg
351mg
75%
Vitamin B1
0.023mg
0.791mg
64%
Phosphorus
234mg
629mg
56%
Vitamin B6
0.156mg
0.79mg
49%
Fiber
0g
11.8g
47%
Monounsaturated fat
0.129g
18.759g
47%
Zinc
3.81mg
7.75mg
36%
Cholesterol
97mg
0mg
32%
Saturated fat
0.201g
6.957g
31%
Calories
83kcal
573kcal
25%
Sodium
563mg
11mg
24%
Vitamin B5
0.997mg
0.05mg
19%
Selenium
42.9µg
34.4µg
15%
Vitamin B2
0.093mg
0.247mg
12%
Folate
51µg
97µg
12%
Vitamin E
1.84mg
0.25mg
11%
Vitamin B3
2.747mg
4.515mg
11%
Choline
80.9mg
25.6mg
10%
Carbs
0g
23.45g
8%
Potassium
259mg
468mg
6%
Vitamin C
3.3mg
0mg
4%
Protein
17.88g
17.73g
0%
Protein per 100 calories
22g
3.1g
N/A
Calories per 10 g protein
46kcal
323kcal
N/A
Weight per 100 calories
120g
17g
N/A
Unsaturated / Saturated Fat ratio
1.9
5.8
N/A
Net carbs
0g
11.65g
N/A
Sugar
0g
0.3g
N/A
Vitamin A
1µg
0µg
0%
Vitamin K
0.3µg
0µg
0%
Trans fat
0.014g
N/A
Tryptophan
0.226mg
0.388mg
0%
Threonine
0.727mg
0.736mg
0%
Isoleucine
0.776mg
0.763mg
0%
Leucine
1.307mg
1.358mg
0%
Lysine
1.386mg
0.569mg
0%
Methionine
0.452mg
0.586mg
0%
Phenylalanine
0.708mg
0.94mg
0%
Valine
0.806mg
0.99mg
0%
Histidine
0.393mg
0.522mg
0%
Omega-3 - EPA
0.101g
0g
N/A
Omega-3 - DHA
0.067g
0g
N/A
Omega-3 - DPA
0.009g
0g
N/A
Omega-6 - Eicosadienoic acid
0.005g
N/A
Macronutrient Comparison
Macronutrient breakdown side-by-side comparison
2
18%
80%
2%
Protein:
17.88 g
Fats:
0.74 g
Carbs:
0 g
Water:
79.69 g
Other:
1.69 g
3
18%
50%
23%
5%
4%
Protein:
17.73 g
Fats:
49.67 g
Carbs:
23.45 g
Water:
4.69 g
Other:
4.46 g
Contains
more
Water Water
+1599.1%
Contains
more
Fats Fats
+6612.2%
Contains
more
Carbs Carbs
+∞%
Contains
more
Other Other
+163.9%
~equal in
Protein
~17.73g
Fat Type Comparison
Fat type breakdown side-by-side comparison
1
34%
22%
44%
Saturated fat:
Sat. Fat
0.201 g
Monounsaturated fat:
Mono. Fat
0.129 g
Polyunsaturated fat:
Poly. Fat
0.258 g
2
15%
40%
46%
Saturated fat:
Sat. Fat
6.957 g
Monounsaturated fat:
Mono. Fat
18.759 g
Polyunsaturated fat:
Poly. Fat
21.773 g
Contains
less
Sat. Fat Saturated fat
-97.1%
Contains
more
Mono. Fat Monounsaturated fat
+14441.9%
Contains
more
Poly. Fat Polyunsaturated fat
+8339.1%