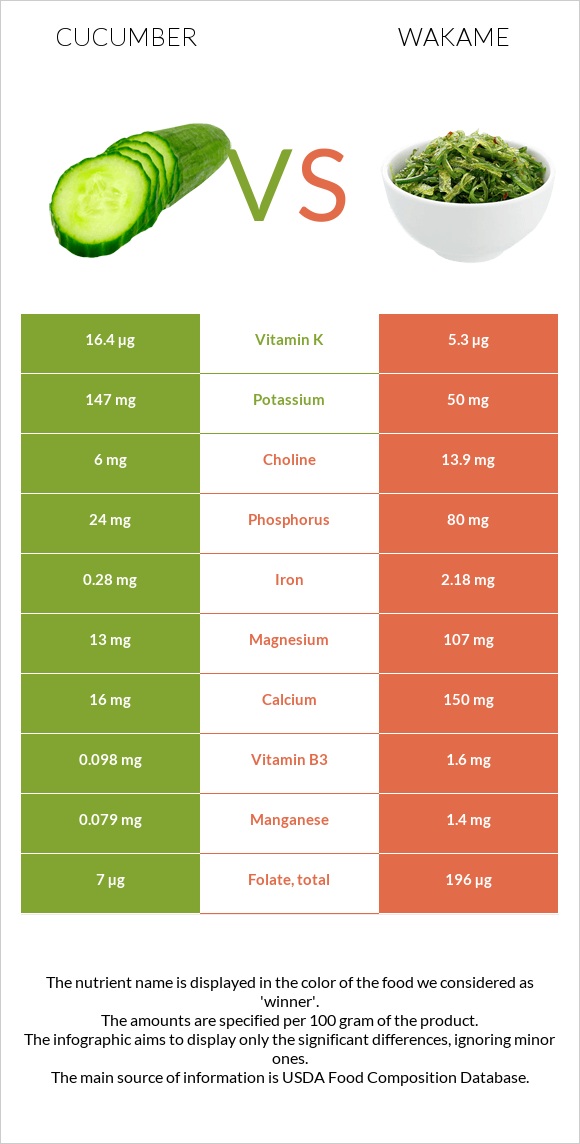
The main differences between cucumber and wakame Cucumber is richer in vitamin K, yet wakame is richer in manganese, folate, copper, iron, magnesium, vitamin B2, calcium, and vitamin B3. Daily need coverage for manganese for wakame is 57% higher. Cucumber contains 3 times more vitamin K than wakame. Cucumber contains 16.4µg of vitamin K, while wakame contains 5.3µg. Cucumber contains less sodium. Food types used in this article are Cucumber, with peel, raw and Seaweed, wakame, raw .
Infographic
Mineral Comparison
Mineral comparison score is based on the number of minerals by which one or the other food is richer. The "coverage" charts below show how much of the daily needs can be covered by 300 grams of the food.
2
100 g
300 g
0.5 cup slices - 52g 1 cucumber (8-1/4") - 301g
Magnesium
Magnesium
Calcium
Calcium
Potassium
Potassium
Iron
Iron
Copper
Copper
Zinc
Zinc
Phosphorus
Phosphorus
Sodium
Sodium
Manganese
Manganese
Selenium
Selenium
9.3%
4.8%
13%
11%
14%
5.5%
10%
0.26%
10%
1.6%
8
100 g
300 g
2 tbsp (1/8 cup) - 10g
Magnesium
Magnesium
Calcium
Calcium
Potassium
Potassium
Iron
Iron
Copper
Copper
Zinc
Zinc
Phosphorus
Phosphorus
Sodium
Sodium
Manganese
Manganese
Selenium
Selenium
76%
45%
4.4%
82%
95%
10%
34%
114%
183%
3.8%
Vitamin Comparison
Vitamin comparison score is based on the number of vitamins by which one or the other food is richer. The "coverage" charts below show how much of the daily needs can be covered by 300 grams of the food.
2
100 g
300 g
0.5 cup slices - 52g 1 cucumber (8-1/4") - 301g
Vitamin C
Vit. C
Vitamin D
Vit. D
Vitamin A
Vit. A
Vitamin E
Vit. E
Vitamin B1
Vit. B1
Vitamin B2
Vit. B2
Vitamin B3
Vit. B3
Vitamin B5
Vit. B5
Vitamin B6
Vit. B6
Vitamin B12
Vit. B12
Vitamin K
Vit. K
Folate
Folate
9.3%
0%
1.7%
0.6%
6.8%
7.6%
1.8%
16%
9.2%
0%
41%
5.3%
7
100 g
300 g
2 tbsp (1/8 cup) - 10g
Vitamin C
Vit. C
Vitamin D
Vit. D
Vitamin A
Vit. A
Vitamin E
Vit. E
Vitamin B1
Vit. B1
Vitamin B2
Vit. B2
Vitamin B3
Vit. B3
Vitamin B5
Vit. B5
Vitamin B6
Vit. B6
Vitamin B12
Vit. B12
Vitamin K
Vit. K
Folate
Folate
10%
0%
6%
20%
15%
53%
30%
42%
0.46%
0%
13%
147%
All nutrients comparison - raw data values
Nutrient
DV% diff.
Manganese
0.079mg
1.4mg
57%
Folate
7µg
196µg
47%
Sodium
2mg
872mg
38%
Copper
0.041mg
0.284mg
27%
Iron
0.28mg
2.18mg
24%
Magnesium
13mg
107mg
22%
Vitamin B2
0.033mg
0.23mg
15%
Calcium
16mg
150mg
13%
Vitamin B3
0.098mg
1.6mg
9%
Vitamin B5
0.259mg
0.697mg
9%
Vitamin K
16.4µg
5.3µg
9%
Phosphorus
24mg
80mg
8%
Vitamin E
0.03mg
1mg
6%
Protein
0.65g
3.03g
5%
Potassium
147mg
50mg
3%
Vitamin B1
0.027mg
0.06mg
3%
Vitamin B6
0.04mg
0.002mg
3%
Calories
15kcal
45kcal
2%
Carbs
3.63g
9.14g
2%
Zinc
0.2mg
0.38mg
2%
Fats
0.11g
0.64g
1%
Vitamin A
5µg
18µg
1%
Selenium
0.3µg
0.7µg
1%
Choline
6mg
13.9mg
1%
Polyunsaturated fat
0.032g
0.218g
1%
Fructose
0.87g
1%
Protein per 100 calories
4.3g
6.7g
N/A
Calories per 10 g protein
231kcal
149kcal
N/A
Weight per 100 calories
667g
222g
N/A
Vitamin C
2.8mg
3mg
0%
Net carbs
3.13g
8.64g
N/A
Sugar
1.67g
0.65g
N/A
Fiber
0.5g
0.5g
0%
Starch
0.83g
0%
Saturated fat
0.037g
0.13g
0%
Monounsaturated fat
0.005g
0.058g
0%
Tryptophan
0.005mg
0.035mg
0%
Threonine
0.019mg
0.165mg
0%
Isoleucine
0.021mg
0.087mg
0%
Leucine
0.029mg
0.257mg
0%
Lysine
0.029mg
0.112mg
0%
Methionine
0.006mg
0.063mg
0%
Phenylalanine
0.019mg
0.112mg
0%
Valine
0.022mg
0.209mg
0%
Histidine
0.01mg
0.015mg
0%
Omega-3 - EPA
0g
0.186g
N/A
Macronutrient Comparison
Macronutrient breakdown side-by-side comparison
1
4%
95%
Protein:
0.65 g
Fats:
0.11 g
Carbs:
3.63 g
Water:
95.23 g
Other:
0.38 g
4
3%
9%
80%
7%
Protein:
3.03 g
Fats:
0.64 g
Carbs:
9.14 g
Water:
79.99 g
Other:
7.2 g
Contains
more
Water Water
+19.1%
Contains
more
Protein Protein
+366.2%
Contains
more
Fats Fats
+481.8%
Contains
more
Carbs Carbs
+151.8%
Contains
more
Other Other
+1794.7%
Fat Type Comparison
Fat type breakdown side-by-side comparison
1
50%
7%
43%
Saturated fat:
Sat. Fat
0.037 g
Monounsaturated fat:
Mono. Fat
0.005 g
Polyunsaturated fat:
Poly. Fat
0.032 g
2
32%
14%
54%
Saturated fat:
Sat. Fat
0.13 g
Monounsaturated fat:
Mono. Fat
0.058 g
Polyunsaturated fat:
Poly. Fat
0.218 g
Contains
less
Sat. Fat Saturated fat
-71.5%
Contains
more
Mono. Fat Monounsaturated fat
+1060%
Contains
more
Poly. Fat Polyunsaturated fat
+581.3%