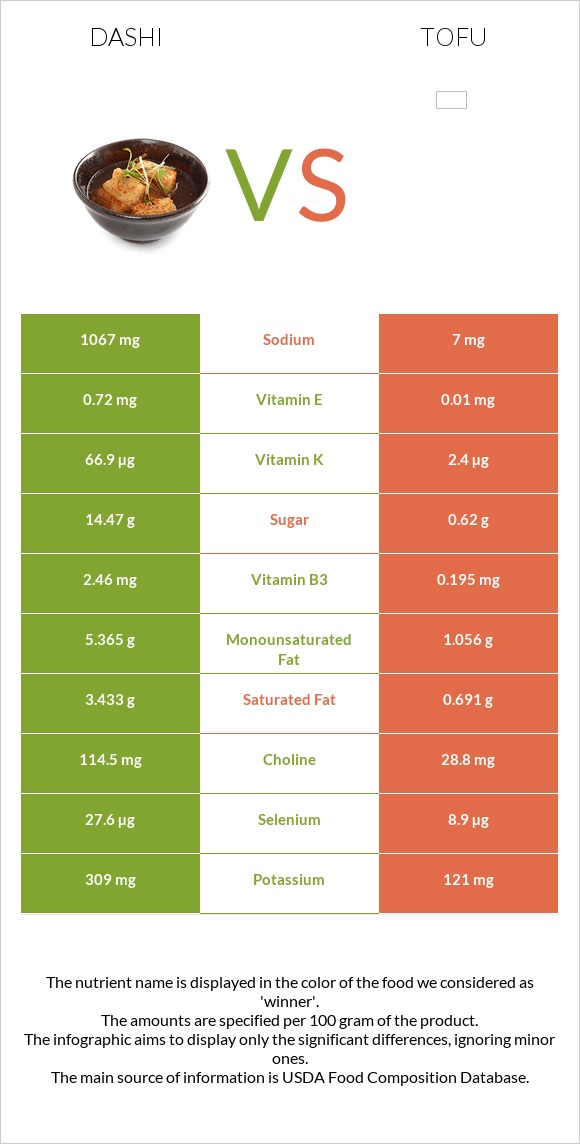
How are dashi and tofu different? Dashi is richer in vitamin K, selenium, vitamin B2, choline, and vitamin B3, while tofu is higher in iron, copper, and calcium. Tofu covers your daily need for iron, 54% more than dashi. Dashi contains 152 times more sodium than tofu. Dashi contains 1067mg of sodium, while tofu contains 7mg. Soup, bouillon cubes, and granules, low sodium, dry and Tofu, raw, regular, prepared with calcium sulfate types were used in this article.
Infographic
Mineral Comparison
Mineral comparison score is based on the number of minerals by which one or the other food is richer. The "coverage" charts below show how much of the daily needs can be covered by 300 grams of the food.
4
100 g
300 g
1 tsp - 2.6g 1 cube - 3.6g
Magnesium
Magnesium
Calcium
Calcium
Potassium
Potassium
Iron
Iron
Copper
Copper
Zinc
Zinc
Phosphorus
Phosphorus
Sodium
Sodium
Manganese
Manganese
Selenium
Selenium
40%
56%
27%
39%
0%
2.5%
71%
139%
0%
151%
6
100 g
300 g
0.25 block - 116g 0.5 cup - 124g
Magnesium
Magnesium
Calcium
Calcium
Potassium
Potassium
Iron
Iron
Copper
Copper
Zinc
Zinc
Phosphorus
Phosphorus
Sodium
Sodium
Manganese
Manganese
Selenium
Selenium
21%
105%
11%
201%
64%
22%
42%
0.91%
79%
49%
Vitamin Comparison
Vitamin comparison score is based on the number of vitamins by which one or the other food is richer. The "coverage" charts below show how much of the daily needs can be covered by 300 grams of the food.
10
100 g
300 g
1 tsp - 2.6g 1 cube - 3.6g
Vitamin C
Vit. C
Vitamin D
Vit. D
Vitamin A
Vit. A
Vitamin E
Vit. E
Vitamin B1
Vit. B1
Vitamin B2
Vit. B2
Vitamin B3
Vit. B3
Vitamin B5
Vit. B5
Vitamin B6
Vit. B6
Vitamin B12
Vit. B12
Vitamin K
Vit. K
Folate
Folate
3.7%
0%
8.3%
14%
25%
99%
46%
0%
23%
38%
167%
16%
1
100 g
300 g
0.25 block - 116g 0.5 cup - 124g
Vitamin C
Vit. C
Vitamin D
Vit. D
Vitamin A
Vit. A
Vitamin E
Vit. E
Vitamin B1
Vit. B1
Vitamin B2
Vit. B2
Vitamin B3
Vit. B3
Vitamin B5
Vit. B5
Vitamin B6
Vit. B6
Vitamin B12
Vit. B12
Vitamin K
Vit. K
Folate
Folate
0.33%
0%
0%
0.2%
20%
12%
3.7%
4.1%
11%
0%
6%
11%
All nutrients comparison - raw data values
Nutrient
DV% diff.
Iron
1.03mg
5.36mg
54%
Vitamin K
66.9µg
2.4µg
54%
Sodium
1067mg
7mg
46%
Selenium
27.6µg
8.9µg
34%
Vitamin B2
0.43mg
0.052mg
29%
Manganese
0.605mg
26%
Carbs
64.88g
1.87g
21%
Copper
0mg
0.193mg
21%
Calories
438kcal
76kcal
18%
Protein
16.7g
8.08g
17%
Calcium
187mg
350mg
16%
Choline
114.5mg
28.8mg
16%
Fats
13.89g
4.78g
14%
Vitamin B3
2.46mg
0.195mg
14%
Vitamin B12
0.3µg
0µg
13%
Saturated fat
3.433g
0.691g
12%
Polyunsaturated fat
4.485g
2.699g
12%
Monounsaturated fat
5.365g
1.056g
11%
Phosphorus
166mg
97mg
10%
Magnesium
56mg
30mg
6%
Potassium
309mg
121mg
6%
Zinc
0.09mg
0.8mg
6%
Vitamin E
0.72mg
0.01mg
5%
Cholesterol
13mg
0mg
4%
Vitamin B6
0.1mg
0.047mg
4%
Vitamin A
25µg
3%
Vitamin B1
0.1mg
0.081mg
2%
Folate
21µg
15µg
2%
Vitamin C
1.1mg
0.1mg
1%
Vitamin B5
0.068mg
1%
Protein per 100 calories
3.8g
11g
N/A
Calories per 10 g protein
262kcal
94kcal
N/A
Weight per 100 calories
23g
132g
N/A
Unsaturated / Saturated Fat ratio
2.9
5.4
N/A
Net carbs
64.68g
1.57g
N/A
Sugar
14.47g
0.62g
N/A
Fiber
0.2g
0.3g
0%
Tryptophan
0.12mg
0%
Threonine
0.402mg
0%
Isoleucine
0.435mg
0%
Leucine
0.713mg
0%
Lysine
0.452mg
0%
Methionine
0.108mg
0%
Phenylalanine
0.428mg
0%
Valine
0.446mg
0%
Histidine
0.221mg
0%
Macronutrient Comparison
Macronutrient breakdown side-by-side comparison
4
17%
14%
65%
2%
2%
Protein:
16.7 g
Fats:
13.89 g
Carbs:
64.88 g
Water:
2.3 g
Other:
2.23 g
1
8%
5%
2%
85%
Protein:
8.08 g
Fats:
4.78 g
Carbs:
1.87 g
Water:
84.55 g
Other:
0.72 g
Contains
more
Protein Protein
+106.7%
Contains
more
Fats Fats
+190.6%
Contains
more
Carbs Carbs
+3369.5%
Contains
more
Other Other
+209.7%
Contains
more
Water Water
+3576.1%
Fat Type Comparison
Fat type breakdown side-by-side comparison
2
26%
40%
34%
Saturated fat:
Sat. Fat
3.433 g
Monounsaturated fat:
Mono. Fat
5.365 g
Polyunsaturated fat:
Poly. Fat
4.485 g
1
16%
24%
61%
Saturated fat:
Sat. Fat
0.691 g
Monounsaturated fat:
Mono. Fat
1.056 g
Polyunsaturated fat:
Poly. Fat
2.699 g
Contains
more
Mono. Fat Monounsaturated fat
+408%
Contains
more
Poly. Fat Polyunsaturated fat
+66.2%
Contains
less
Sat. Fat Saturated fat
-79.9%