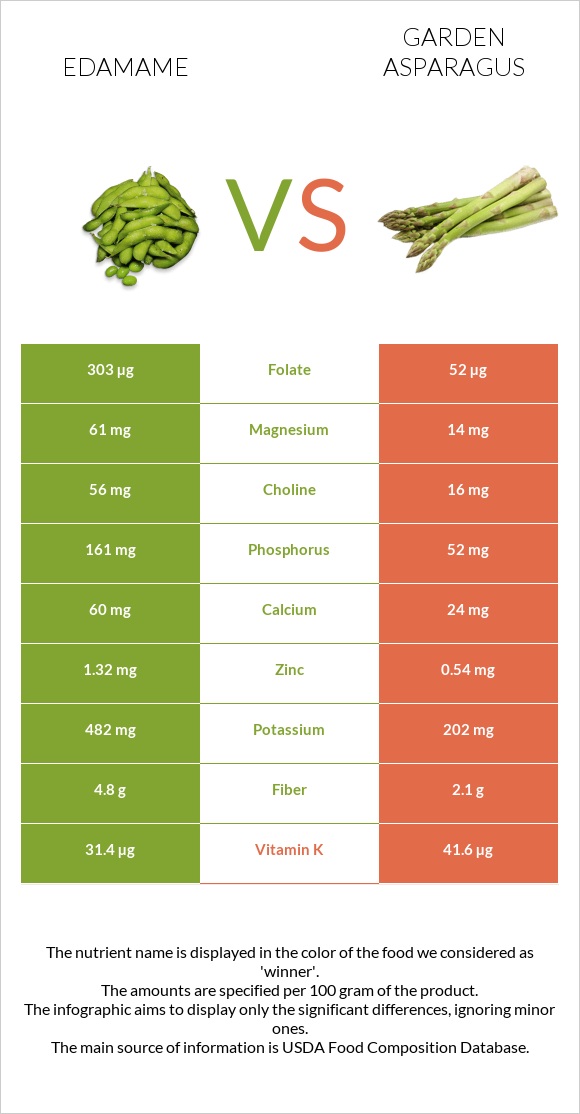
Summary of differences between edamame and asparagus Edamame has more folate, manganese, copper, phosphorus, fiber, magnesium, zinc, and choline, while asparagus has more vitamin K and vitamin A. Edamame covers your daily need for folate, 65% more than asparagus. Edamame contains 6 times more manganese than asparagus. While edamame contains 1.024mg of manganese, asparagus contains only 0.158mg. These are the specific foods used in this comparison Edamame, frozen, prepared and Asparagus, raw .
Infographic
Mineral Comparison
Mineral comparison score is based on the number of minerals by which one or the other food is richer. The "coverage" charts below show how much of the daily needs can be covered by 300 grams of the food.
7
100 g
300 g
1 cup - 155g
Magnesium
Magnesium
Calcium
Calcium
Potassium
Potassium
Iron
Iron
Copper
Copper
Zinc
Zinc
Phosphorus
Phosphorus
Sodium
Sodium
Manganese
Manganese
Selenium
Selenium
46%
19%
38%
85%
115%
37%
72%
0.78%
134%
4.4%
2
100 g
300 g
1 spear tip (2" long or less) - 3.5g 1 spear, small (5" long or less) - 12g 1 spear, medium (5-1/4" to 7" long) - 16g 1 spear, large (7-1/4" to 8-1/2") - 20g 1 spear, extra large (8-3/4" to 10" long) - 24g 1 cup - 134g
Magnesium
Magnesium
Calcium
Calcium
Potassium
Potassium
Iron
Iron
Copper
Copper
Zinc
Zinc
Phosphorus
Phosphorus
Sodium
Sodium
Manganese
Manganese
Selenium
Selenium
10%
7.2%
18%
80%
63%
15%
22%
0.26%
21%
13%
Vitamin Comparison
Vitamin comparison score is based on the number of vitamins by which one or the other food is richer. The "coverage" charts below show how much of the daily needs can be covered by 300 grams of the food.
3
100 g
300 g
1 cup - 155g
Vitamin C
Vit. C
Vitamin D
Vit. D
Vitamin A
Vit. A
Vitamin E
Vit. E
Vitamin B1
Vit. B1
Vitamin B2
Vit. B2
Vitamin B3
Vit. B3
Vitamin B5
Vit. B5
Vitamin B6
Vit. B6
Vitamin B12
Vit. B12
Vitamin K
Vit. K
Folate
Folate
20%
0%
5%
14%
50%
36%
17%
24%
23%
0%
67%
233%
3
100 g
300 g
1 spear tip (2" long or less) - 3.5g 1 spear, small (5" long or less) - 12g 1 spear, medium (5-1/4" to 7" long) - 16g 1 spear, large (7-1/4" to 8-1/2") - 20g 1 spear, extra large (8-3/4" to 10" long) - 24g 1 cup - 134g
Vitamin C
Vit. C
Vitamin D
Vit. D
Vitamin A
Vit. A
Vitamin E
Vit. E
Vitamin B1
Vit. B1
Vitamin B2
Vit. B2
Vitamin B3
Vit. B3
Vitamin B5
Vit. B5
Vitamin B6
Vit. B6
Vitamin B12
Vit. B12
Vitamin K
Vit. K
Folate
Folate
19%
0%
13%
23%
36%
33%
18%
16%
21%
0%
104%
39%
All nutrients comparison - raw data values
Nutrient
DV% diff.
Folate
311µg
52µg
65%
Manganese
1.024mg
0.158mg
38%
Protein
11.91g
2.2g
19%
Copper
0.345mg
0.189mg
17%
Phosphorus
169mg
52mg
17%
Polyunsaturated fat
2.156g
0.05g
14%
Magnesium
64mg
14mg
12%
Fiber
5.2g
2.1g
12%
Vitamin K
26.7µg
41.6µg
12%
Fats
5.2g
0.12g
8%
Zinc
1.37mg
0.54mg
8%
Potassium
436mg
202mg
7%
Choline
56.3mg
16mg
7%
Calories
121kcal
20kcal
5%
Vitamin B1
0.2mg
0.143mg
5%
Calcium
63mg
24mg
4%
Vitamin A
15µg
38µg
3%
Vitamin E
0.68mg
1.13mg
3%
Selenium
0.8µg
2.3µg
3%
Saturated fat
0.62g
0.04g
3%
Monounsaturated fat
1.282g
0g
3%
Carbs
8.91g
3.88g
2%
Iron
2.27mg
2.14mg
2%
Vitamin B5
0.395mg
0.274mg
2%
Vitamin C
6.1mg
5.6mg
1%
Starch
1.51g
1%
Vitamin B2
0.155mg
0.141mg
1%
Vitamin B6
0.1mg
0.091mg
1%
Fructose
0.12g
1g
1%
Protein per 100 calories
9.8g
11g
N/A
Calories per 10 g protein
102kcal
91kcal
N/A
Weight per 100 calories
83g
500g
N/A
Unsaturated / Saturated Fat ratio
5.5
1.3
N/A
Net carbs
3.71g
1.78g
N/A
Sugar
2.18g
1.88g
N/A
Sodium
6mg
2mg
0%
Vitamin B3
0.915mg
0.978mg
0%
Trans fat
0.009g
0g
N/A
Tryptophan
0.126mg
0.027mg
0%
Threonine
0.331mg
0.084mg
0%
Isoleucine
0.3mg
0.075mg
0%
Leucine
0.745mg
0.128mg
0%
Lysine
0.745mg
0.104mg
0%
Methionine
0.141mg
0.031mg
0%
Phenylalanine
0.488mg
0.075mg
0%
Valine
0.324mg
0.115mg
0%
Histidine
0.267mg
0.049mg
0%
Omega-3 - EPA
0.003g
0g
N/A
Omega-3 - ALA
0.358g
N/A
Omega-6 - Eicosadienoic acid
0.002g
0g
N/A
Omega-6 - Linoleic acid
1.789g
N/A
Macronutrient Comparison
Macronutrient breakdown side-by-side comparison
4
12%
5%
9%
73%
Protein:
11.91 g
Fats:
5.2 g
Carbs:
8.91 g
Water:
72.77 g
Other:
1.21 g
1
2%
4%
93%
Protein:
2.2 g
Fats:
0.12 g
Carbs:
3.88 g
Water:
93.22 g
Other:
0.58 g
Contains
more
Protein Protein
+441.4%
Contains
more
Fats Fats
+4233.3%
Contains
more
Carbs Carbs
+129.6%
Contains
more
Other Other
+108.6%
Contains
more
Water Water
+28.1%
Fat Type Comparison
Fat type breakdown side-by-side comparison
2
15%
32%
53%
Saturated fat:
Sat. Fat
0.62 g
Monounsaturated fat:
Mono. Fat
1.282 g
Polyunsaturated fat:
Poly. Fat
2.156 g
1
44%
56%
Saturated fat:
Sat. Fat
0.04 g
Monounsaturated fat:
Mono. Fat
0 g
Polyunsaturated fat:
Poly. Fat
0.05 g
Contains
more
Mono. Fat Monounsaturated fat
+∞%
Contains
more
Poly. Fat Polyunsaturated fat
+4212%
Contains
less
Sat. Fat Saturated fat
-93.5%
Carbohydrate type comparison
Carbohydrate type breakdown side-by-side comparison
3
41%
30%
3%
26%
Starch:
1.51 g
Sucrose:
1.12 g
Glucose:
0 g
Fructose:
0.12 g
Lactose:
0 g
Maltose:
0.95 g
Galactose:
0 g
2
12%
35%
53%
Starch:
0 g
Sucrose:
0.23 g
Glucose:
0.65 g
Fructose:
1 g
Lactose:
0 g
Maltose:
0 g
Galactose:
0 g
Contains
more
Starch Starch
+∞%
Contains
more
Sucrose Sucrose
+387%
Contains
more
Maltose Maltose
+∞%
Contains
more
Glucose Glucose
+∞%
Contains
more
Fructose Fructose
+733.3%
~equal in
Lactose
~0g
~equal in
Galactose
~0g