Edamame nutrition: calories, carbs, GI, protein, fiber, fats
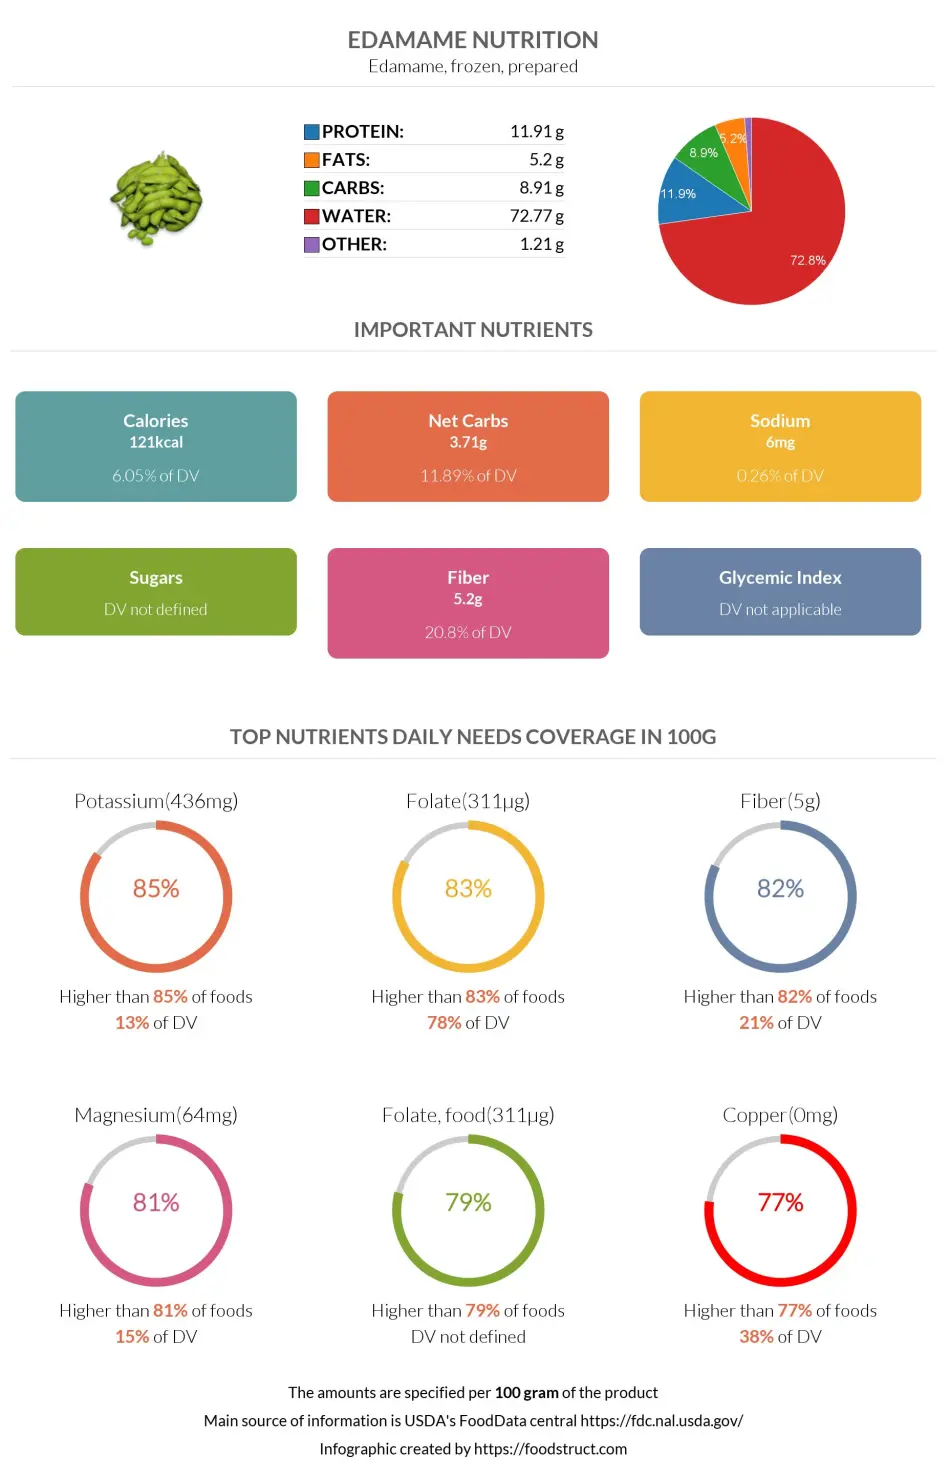
Edamame, frozen, prepared
*all the values are displayed for the amount of 100 grams
Top nutrition facts for Edamame
| Calories ⓘ Calories for selected serving | 121 kcal |
| Glycemic load ⓘ Glycemic Load (GL) is a metric that measures both the quality (Glycemic Index) and quantity of carbohydrates in a specific serving of food to estimate its impact on blood sugar levels. It is calculated as: (GI × Carbs in grams) / 100. | 0 (low) |
| Net carbs ⓘ Net Carbs = Total Carbohydrates – Fiber – Sugar Alcohols | 4 g |
| Default serving size ⓘ Serving sizes are mostly taken from FDA's Reference Amounts Customarily Consumed (RACCs) | 1 cup (155 g) |
| Acidity (Based on PRAL) ⓘ PRAL (Potential renal acid load) is calculated using a formula. On the PRAL scale the higher the positive value, the more is the acidifying effect on the body. The lower the negative value, the higher the alkalinity of the food. 0 is neutral. | 0.4 (acidic) |
| Oxalates | 44 mg ⓘ https://core.ac.uk/reader/38935472?utm_source=linkout |

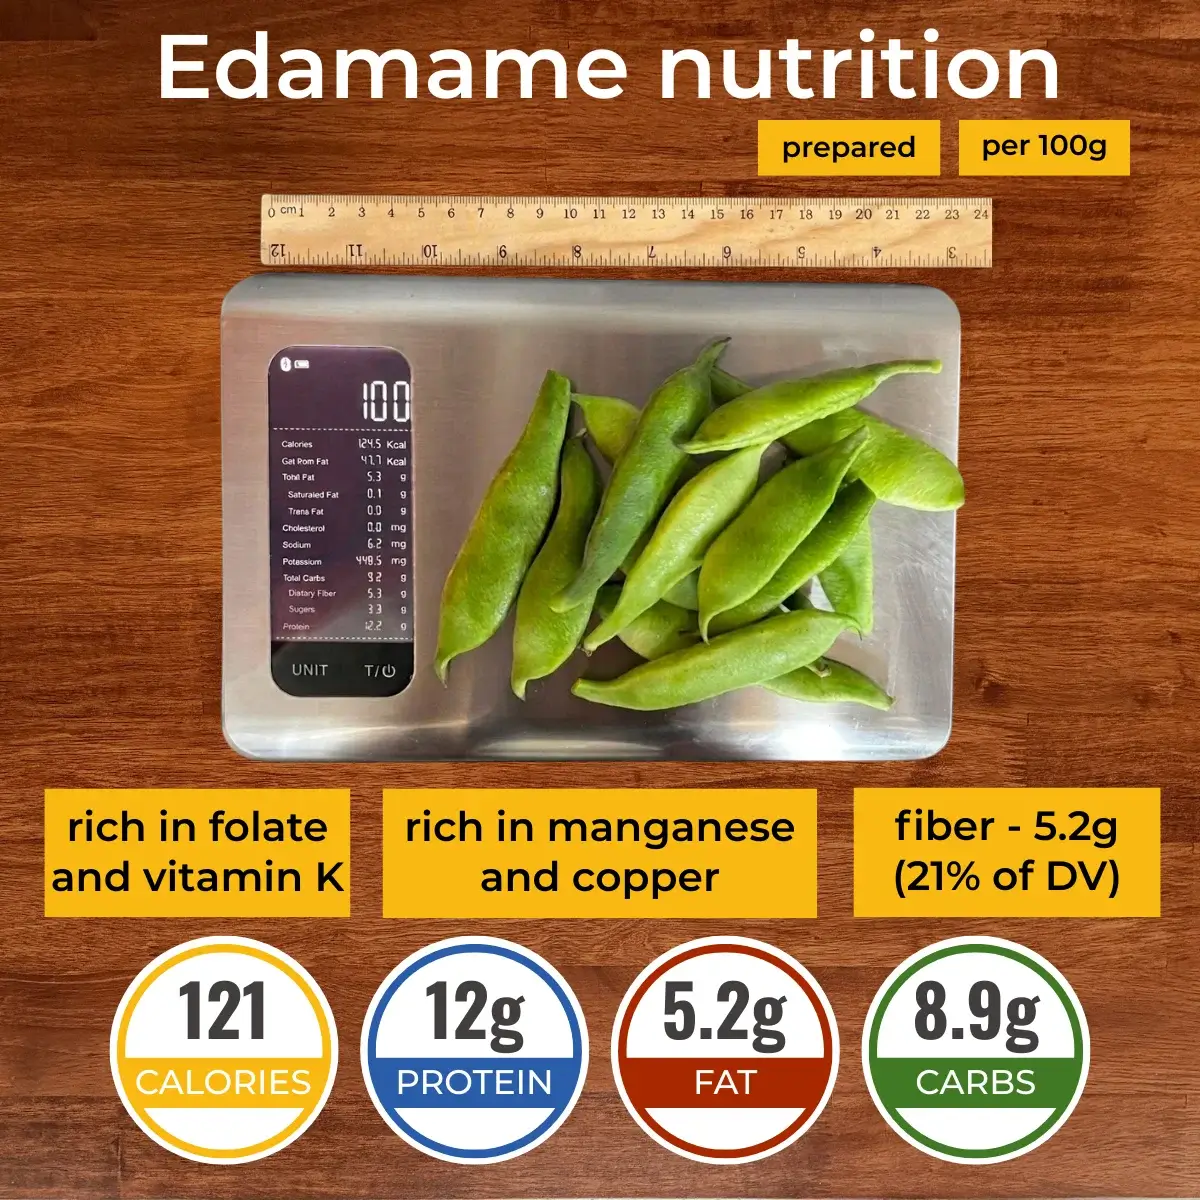
What Do 124 Calories or 100 Grams of Edamame Look Like?
The image displays 100 grams of edamame, which provides around 121-124 calories. Edamame offers a balanced mix of protein, fiber, and healthy fats. The calories primarily come from fat and protein, with a moderate amount of carbohydrates. A typical serving of edamame consists of 155 grams (about one cup).
Due to its high protein and fiber content, it supports muscle recovery and overall digestive health.

Edamame calories (kcal)
| Calories for different serving sizes of edamame | Calories | Weight |
|---|---|---|
| Calories in 100 grams | 121 | |
| Calories in 1 cup | 188 | 155 g |
| Calories for different varieties of edamame | Calories | Weight |
|---|---|---|
| Edamame, frozen, prepared (this food) | 121 | 100 g |
| Edamame unprepared | 109 | 100 g |
Extra Nutrition facts for Edamame
| Protein per 100 calories ⓘ Shows how many grams of protein you get from 100 calories of this food, calculated as (protein in g ÷ calories) × 100. | 9.8 g |
| Calories per 10 g protein ⓘ Shows how many calories you need to eat from this food to get 10 g of protein, calculated as (calories ÷ protein in g) × 10. | 102 kcal |
| Weight per 100 calories ⓘ Shows how many grams of this food equal 100 kcal—higher grams mean a larger portion for the same calories. | 83 g |
| Unsaturated / Saturated Fat ratio ⓘ (monounsaturated + polyunsaturated) / saturated, ≥2 broadly recommended by major guidelines for heart health | 5.5 |
Mineral coverage chart
Mineral chart - relative view
Vitamin coverage chart
Vitamin A:
45µg of 900µg
5%
Vitamin E:
2mg of 15mg
14%
Vitamin D:
0µg of 20µg
0%
Vitamin C:
18mg of 90mg
20%
Vitamin B1:
0.6mg of 1mg
50%
Vitamin B2:
0.47mg of 1mg
36%
Vitamin B3:
2.7mg of 16mg
17%
Vitamin B5:
1.2mg of 5mg
24%
Vitamin B6:
0.3mg of 1mg
23%
Folate:
933µg of 400µg
233%
Vitamin B12:
0µg of 2µg
0%
Vitamin K:
80µg of 120µg
67%
Vitamin chart - relative view
Macronutrients chart
Protein:
Daily Value: 24%
11.9 g of 50 g
11.9 g (24% of DV )
Fats:
Daily Value: 8%
5.2 g of 65 g
5.2 g (8% of DV )
Carbs:
Daily Value: 3%
8.9 g of 300 g
8.9 g (3% of DV )
Water:
Daily Value: 4%
72.8 g of 2,000 g
72.8 g (4% of DV )
Other:
1.2 g
1.2 g
Protein quality breakdown
Tryptophan:
378mg of 280mg
135%
Threonine:
993mg of 1,050mg
95%
Isoleucine:
900mg of 1,400mg
64%
Leucine:
2235mg of 2,730mg
82%
Lysine:
2235mg of 2,100mg
106%
Methionine:
423mg of 1,050mg
40%
Phenylalanine:
1464mg of 1,750mg
84%
Valine:
972mg of 1,820mg
53%
Histidine:
801mg of 700mg
114%
Fat type information
Saturated fat:
0.62 g
Monounsaturated fat:
1.3 g
Polyunsaturated fat:
2.2 g
Carbohydrate type breakdown
Starch:
1.5 g
Sucrose:
1.1 g
Glucose:
0 g
Fructose:
0.12 g
Lactose:
0 g
Maltose:
0.95 g
Galactose:
0 g
Fiber content ratio for Edamame
Sugar:
2.2 g
Fiber:
5.2 g
Other:
1.5 g
All nutrients for Edamame per 100g
| Nutrient | Value | DV% | In TOP % of foods | Comparison |
| Vitamin A | 15µg | 2% | 29% | |
| Calories | 121kcal | 6% | 68% |
2.6 times more than Orange
|
| Protein per 100 calories | 9.8g | N/A | 26% | |
| Calories per 10 g protein | 102kcal | N/A | 70% | |
| Protein | 12g | 28% | 40% |
4.2 times more than Broccoli
|
| Weight per 100 calories | 83g | N/A | 33% | |
| Fats | 5.2g | 8% | 50% |
6.4 times less than Cheese
|
| Unsaturated / Saturated Fat ratio | 5.5 | N/A | 7% | |
| Vitamin C | 6.1mg | 7% | 19% |
8.7 times less than Lemon
|
| Net carbs | 3.7g | N/A | 61% |
14.6 times less than Chocolate
|
| Carbs | 8.9g | 3% | 51% |
3.2 times less than Rice
|
| Cholesterol | 0mg | 0% | 100% |
N/A
|
| Vitamin D* | 0 IU | 0% | 100% |
N/A
|
| Vitamin D | 0µg | 0% | 100% |
N/A
|
| Magnesium | 64mg | 15% | 11% |
2.2 times less than Almonds
|
| Calcium | 63mg | 6% | 26% |
2 times less than Milk
|
| Potassium | 436mg | 13% | 11% |
3 times more than Cucumber
|
| Iron | 2.3mg | 28% | 31% |
1.1 times less than Beef broiled
|
| Sugar | 2.2g | N/A | 38% |
4.1 times less than Coca-Cola
|
| Fiber | 5.2g | 21% | 11% |
2.2 times more than Orange
|
| Copper | 0.35mg | 38% | 10% |
2.4 times more than Shiitake
|
| Zinc | 1.4mg | 12% | 40% |
4.6 times less than Beef broiled
|
| Starch | 1.5g | 1% | 10% |
10.1 times less than Potato
|
| Phosphorus | 169mg | 24% | 41% |
1.1 times less than Chicken meat
|
| Sodium | 6mg | 0% | 88% |
81.7 times less than White bread
|
| Vitamin E | 0.68mg | 5% | 19% |
2.1 times less than Kiwi
|
| Manganese | 1mg | 45% | 8% | |
| Selenium | 0.8µg | 1% | 65% | |
| Vitamin B1 | 0.2mg | 17% | 28% |
1.3 times less than Pea raw
|
| Vitamin B2 | 0.16mg | 12% | 50% |
1.2 times more than Avocado
|
| Vitamin B3 | 0.92mg | 6% | 63% |
10.5 times less than Turkey meat
|
| Vitamin B5 | 0.4mg | 8% | 41% |
2.9 times less than Sunflower seeds
|
| Vitamin B6 | 0.1mg | 8% | 55% |
1.2 times less than Oats
|
| Vitamin B12 | 0µg | 0% | 100% |
N/A
|
| Vitamin K | 27µg | 22% | 6% |
3.8 times less than Broccoli
|
| Trans fat | 0.01g | N/A | 29% |
1654.4 times less than Margarine
|
| Folate | 311µg | 78% | 3% |
5.1 times more than Brussels sprouts
|
| Saturated fat | 0.62g | 3% | 64% |
9.5 times less than Beef broiled
|
| Choline | 56mg | 10% | 19% | |
| Monounsaturated fat | 1.3g | N/A | 54% |
7.6 times less than Avocado
|
| Polyunsaturated fat | 2.2g | N/A | 23% |
21.9 times less than Walnut
|
| Tryptophan | 0.13mg | 0% | 34% |
2.4 times less than Chicken meat
|
| Threonine | 0.33mg | 0% | 36% |
2.2 times less than Beef broiled
|
| Isoleucine | 0.3mg | 0% | 40% |
3 times less than Salmon raw
|
| Leucine | 0.75mg | 0% | 36% |
3.3 times less than Tuna Bluefin
|
| Lysine | 0.75mg | 0% | 33% |
1.6 times more than Tofu
|
| Methionine | 0.14mg | 0% | 39% |
1.5 times more than Quinoa
|
| Phenylalanine | 0.49mg | 0% | 35% |
1.4 times less than Egg
|
| Valine | 0.32mg | 0% | 41% |
6.3 times less than Soybean raw
|
| Histidine | 0.27mg | 0% | 35% |
2.8 times less than Turkey meat
|
| Fructose | 0.12g | 0% | 12% |
49.2 times less than Apple
|
| Caffeine | 0mg | 0% | 100% | |
| Omega-3 - EPA | 0g | N/A | 14% |
230 times less than Salmon
|
| Omega-3 - DHA | 0g | N/A | 100% |
N/A
|
| Omega-3 - ALA | 0.36g | N/A | 3% |
25.5 times less than Canola oil
|
| Omega-3 - DPA | 0g | N/A | 100% |
N/A
|
| Omega-3 - Eicosatrienoic acid | 0g | N/A | 100% | |
| Omega-6 - Gamma-linoleic acid | 0g | N/A | 100% | |
| Omega-6 - Dihomo-gamma-linoleic acid | 0g | N/A | 100% | |
| Omega-6 - Eicosadienoic acid | 0g | N/A | 16% | |
| Omega-6 - Linoleic acid | 1.8g | N/A | 6% |
6.9 times less than Almonds
|
Check out similar food or compare with current
NUTRITION FACTS LABEL
Nutrition Facts
___servings per container
Serving Size ______________
Serving Size ______________
Amount Per 100g
Calories 121
% Daily Value*
8%
Total Fat
5.2g
2.8%
Saturated Fat 0.62g
0
Trans Fat
0g
0
Cholesterol 0mg
0.26%
Sodium 6mg
3%
Total Carbohydrate
8.9g
21%
Dietary Fiber
5.2g
Total Sugars 0g
Includes ? g Added Sugars
Protein
12g
Vitamin D
0mcg
0
Calcium
63mg
6.3%
Iron
2.3mg
28%
Potassium
436mg
13%
*
The % Daily Value (DV) tells you how much a nutrient in a serving of food contributes to a daily diet. 2,000 calories a day is used for general nutrition advice.
Health checks
ⓘ
Dietary cholesterol is not associated with an increased risk of coronary heart disease in healthy individuals. However, dietary cholesterol is common in foods that are high in harmful saturated fats.
Source
Low in Cholesterol
ⓘ
Trans fat consumption increases the risk of cardiovascular disease and mortality by negatively affecting blood lipid levels.
Source
No Trans Fats
ⓘ
Saturated fat intake can raise total cholesterol and LDL (low-density lipoprotein) levels, leading to an increased risk of atherosclerosis. Dietary guidelines recommend limiting saturated fats to under 10% of calories a day.
Source
Low in Saturated Fats
ⓘ
While the consumption of moderate amounts of added sugars is not detrimental to health, an excessive intake can increase the risk of obesity, and therefore, diabetes.
Source
Low in Sugars
Edamame nutrition infographic
Infographic link
References
All the values for which the sources are not specified explicitly are taken from FDA’s Food Central. The exact link to the food presented on this page can be found below.