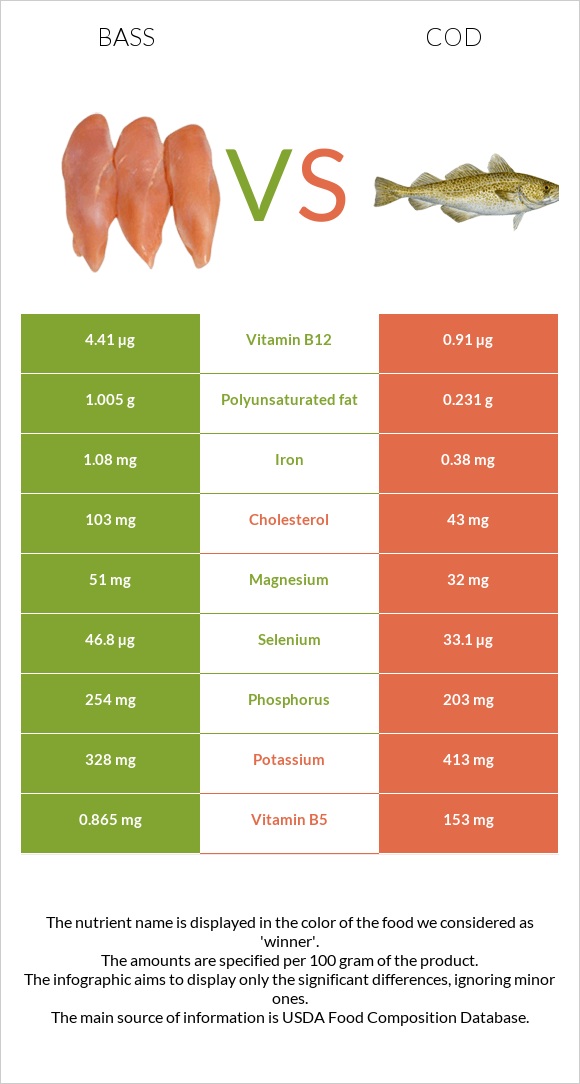
Summary of differences between sea bass and cod Sea bass has more vitamin B12, selenium, iron, vitamin B6, phosphorus, and polyunsaturated fat; however, cod is higher in vitamin B5. Cod covers your daily need for vitamin B5, 3043% more than sea bass. Sea bass has 5 times more vitamin B12 than cod. While sea bass has 4.41µg of vitamin B12, cod has only 0.91µg. Cod has less cholesterol. These are the specific foods used in this comparison Fish, bass, striped, cooked, dry heat and Fish, cod, Atlantic, raw .
Infographic
Mineral Comparison
Mineral comparison score is based on the number of minerals by which one or the other food is richer. The "coverage" charts below show how much of the daily needs can be covered by 300 grams of the food.
8
100 g
300 g
3 oz - 85g 1 fillet - 124g
Magnesium
Magnesium
Calcium
Calcium
Potassium
Potassium
Iron
Iron
Copper
Copper
Zinc
Zinc
Phosphorus
Phosphorus
Sodium
Sodium
Manganese
Manganese
Selenium
Selenium
36%
5.7%
29%
41%
13%
14%
109%
11%
2.5%
255%
2
100 g
300 g
3 oz - 85g 1 fillet - 231g
Magnesium
Magnesium
Calcium
Calcium
Potassium
Potassium
Iron
Iron
Copper
Copper
Zinc
Zinc
Phosphorus
Phosphorus
Sodium
Sodium
Manganese
Manganese
Selenium
Selenium
23%
4.8%
36%
14%
9.3%
12%
87%
7%
2%
181%
Vitamin Comparison
Vitamin comparison score is based on the number of vitamins by which one or the other food is richer. The "coverage" charts below show how much of the daily needs can be covered by 300 grams of the food.
6
100 g
300 g
3 oz - 85g 1 fillet - 124g
Vitamin C
Vit. C
Vitamin D
Vit. D
Vitamin A
Vit. A
Vitamin E
Vit. E
Vitamin B1
Vit. B1
Vitamin B2
Vit. B2
Vitamin B3
Vit. B3
Vitamin B5
Vit. B5
Vitamin B6
Vit. B6
Vitamin B12
Vit. B12
Vitamin K
Vit. K
Folate
Folate
0%
0%
10%
0%
29%
8.5%
48%
52%
80%
551%
0%
7.5%
6
100 g
300 g
3 oz - 85g 1 fillet - 231g
Vitamin C
Vit. C
Vitamin D
Vit. D
Vitamin A
Vit. A
Vitamin E
Vit. E
Vitamin B1
Vit. B1
Vitamin B2
Vit. B2
Vitamin B3
Vit. B3
Vitamin B5
Vit. B5
Vitamin B6
Vit. B6
Vitamin B12
Vit. B12
Vitamin K
Vit. K
Folate
Folate
3.3%
14%
4%
13%
19%
15%
39%
9180%
57%
114%
0.25%
5.3%
All nutrients comparison - raw data values
Nutrient
DV% diff.
Vitamin B5
0.865mg
153mg
3043%
Vitamin B12
4.41µg
0.91µg
146%
Selenium
46.8µg
33.1µg
25%
Cholesterol
103mg
43mg
20%
Choline
65.2mg
12%
Protein
22.73g
17.81g
10%
Iron
1.08mg
0.38mg
9%
Vitamin B6
0.346mg
0.245mg
8%
Phosphorus
254mg
203mg
7%
Vitamin D*
36 IU
5%
Vitamin D
0.9µg
5%
Magnesium
51mg
32mg
5%
Polyunsaturated fat
1.005g
0.231g
5%
Fats
2.99g
0.67g
4%
Vitamin E
0.64mg
4%
Potassium
328mg
413mg
3%
Vitamin B1
0.115mg
0.076mg
3%
Vitamin B3
2.558mg
2.063mg
3%
Calories
124kcal
82kcal
2%
Vitamin A
31µg
12µg
2%
Vitamin B2
0.037mg
0.065mg
2%
Saturated fat
0.65g
0.131g
2%
Monounsaturated fat
0.846g
0.094g
2%
Vitamin C
0mg
1mg
1%
Copper
0.04mg
0.028mg
1%
Zinc
0.51mg
0.45mg
1%
Sodium
88mg
54mg
1%
Folate
10µg
7µg
1%
Protein per 100 calories
18g
22g
N/A
Calories per 10 g protein
55kcal
46kcal
N/A
Weight per 100 calories
81g
122g
N/A
Unsaturated / Saturated Fat ratio
2.8
2.5
N/A
Calcium
19mg
16mg
0%
Manganese
0.019mg
0.015mg
0%
Vitamin K
0.1µg
0%
Tryptophan
0.255mg
0.199mg
0%
Threonine
0.997mg
0.781mg
0%
Isoleucine
1.047mg
0.821mg
0%
Leucine
1.848mg
1.447mg
0%
Lysine
2.088mg
1.635mg
0%
Methionine
0.673mg
0.527mg
0%
Phenylalanine
0.887mg
0.695mg
0%
Valine
1.171mg
0.917mg
0%
Histidine
0.669mg
0.524mg
0%
Omega-3 - EPA
0.217g
0.064g
N/A
Omega-3 - DHA
0.75g
0.12g
N/A
Omega-3 - DPA
0.01g
N/A
Macronutrient Comparison
Macronutrient breakdown side-by-side comparison
3
23%
3%
73%
Protein:
22.73 g
Fats:
2.99 g
Carbs:
0 g
Water:
73.36 g
Other:
0.92 g
1
18%
81%
Protein:
17.81 g
Fats:
0.67 g
Carbs:
0 g
Water:
81.22 g
Other:
0.3 g
Contains
more
Protein Protein
+27.6%
Contains
more
Fats Fats
+346.3%
Contains
more
Other Other
+206.7%
Contains
more
Water Water
+10.7%
Fat Type Comparison
Fat type breakdown side-by-side comparison
2
26%
34%
40%
Saturated fat:
Sat. Fat
0.65 g
Monounsaturated fat:
Mono. Fat
0.846 g
Polyunsaturated fat:
Poly. Fat
1.005 g
1
29%
21%
51%
Saturated fat:
Sat. Fat
0.131 g
Monounsaturated fat:
Mono. Fat
0.094 g
Polyunsaturated fat:
Poly. Fat
0.231 g
Contains
more
Mono. Fat Monounsaturated fat
+800%
Contains
more
Poly. Fat Polyunsaturated fat
+335.1%
Contains
less
Sat. Fat Saturated fat
-79.8%