Salmon raw vs. Cheese — In-Depth Nutrition Comparison
Compare
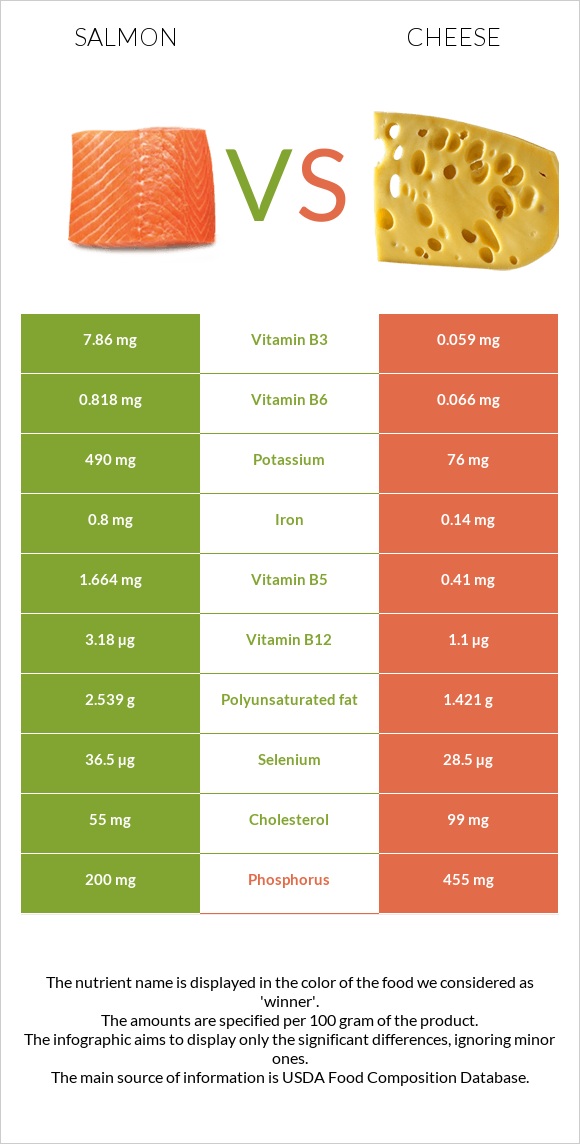
A recap on the differences between salmon raw and cheese
- Salmon raw is higher in vitamin B12, vitamin B6, vitamin B3, vitamin B5, and copper, yet cheese is higher in calcium, phosphorus, and zinc.
- Cheese covers your daily saturated fat needs 89% more than salmon raw.
- Salmon raw contains 133 times more vitamin B3 than cheese. While salmon raw contains 7.86mg of vitamin B3, cheese contains only 0.059mg.
- The amount of sodium in salmon raw is lower.
Food varieties used in this article are Fish, salmon, Atlantic, wild, raw and Cheese, cheddar.
Infographic
Infographic link
Mineral Comparison
Mineral comparison score is based on the number of minerals by which one or the other food is richer. The "coverage" charts below show how much of the daily needs can be covered by 300 grams of the food.
| Contains more PotassiumPotassium | +544.7% |
| Contains more IronIron | +471.4% |
| Contains more CopperCopper | +733.3% |
| Contains less SodiumSodium | -93.3% |
| Contains more SeleniumSelenium | +28.1% |
| Contains more CalciumCalcium | +5816.7% |
| Contains more ZincZinc | +468.8% |
| Contains more PhosphorusPhosphorus | +127.5% |
| Contains more ManganeseManganese | +68.8% |
Vitamin Comparison
Vitamin comparison score is based on the number of vitamins by which one or the other food is richer. The "coverage" charts below show how much of the daily needs can be covered by 300 grams of the food.
| Contains more Vitamin B1Vitamin B1 | +679.3% |
| Contains more Vitamin B3Vitamin B3 | +13222% |
| Contains more Vitamin B5Vitamin B5 | +305.9% |
| Contains more Vitamin B6Vitamin B6 | +1139.4% |
| Contains more Vitamin B12Vitamin B12 | +189.1% |
| Contains more Vitamin AVitamin A | +2650% |
| Contains more Vitamin B2Vitamin B2 | +12.6% |
All nutrients comparison - raw data values
| Nutrient |  |
 |
DV% diff. |
| Vitamin B12 | 3.18µg | 1.1µg | 87% |
| Saturated fat | 0.981g | 18.867g | 81% |
| Calcium | 12mg | 710mg | 70% |
| Vitamin B6 | 0.818mg | 0.066mg | 58% |
| Vitamin B3 | 7.86mg | 0.059mg | 49% |
| Fats | 6.34g | 33.31g | 41% |
| Phosphorus | 200mg | 455mg | 36% |
| Vitamin A | 12µg | 330µg | 35% |
| Zinc | 0.64mg | 3.64mg | 27% |
| Sodium | 44mg | 653mg | 26% |
| Vitamin B5 | 1.664mg | 0.41mg | 25% |
| Copper | 0.25mg | 0.03mg | 24% |
| Monounsaturated fat | 2.103g | 9.246g | 18% |
| Vitamin B1 | 0.226mg | 0.029mg | 16% |
| Cholesterol | 55mg | 99mg | 15% |
| Selenium | 36.5µg | 28.5µg | 15% |
| Calories | 142kcal | 404kcal | 13% |
| Potassium | 490mg | 76mg | 12% |
| Iron | 0.8mg | 0.14mg | 8% |
| Polyunsaturated fat | 2.539g | 1.421g | 7% |
| Protein | 19.84g | 22.87g | 6% |
| Vitamin E | 0.71mg | 5% | |
| Vitamin B2 | 0.38mg | 0.428mg | 4% |
| Vitamin D* | 24 IU | 3% | |
| Vitamin D | 0.6µg | 3% | |
| Choline | 16.5mg | 3% | |
| Vitamin K | 2.4µg | 2% | |
| Carbs | 0g | 3.09g | 1% |
| Folate | 25µg | 27µg | 1% |
| Protein per 100 calories | 14g | 5.7g | N/A |
| Calories per 10 g protein | 72kcal | 177kcal | N/A |
| Weight per 100 calories | 70g | 25g | N/A |
| Unsaturated / Saturated Fat ratio | 4.7 | 0.57 | N/A |
| Net carbs | 0g | 3.09g | N/A |
| Magnesium | 29mg | 27mg | 0% |
| Sugar | 0.48g | N/A | |
| Manganese | 0.016mg | 0.027mg | 0% |
| Trans fat | 0.917g | N/A | |
| Tryptophan | 0.222mg | 0.547mg | 0% |
| Threonine | 0.87mg | 1.044mg | 0% |
| Isoleucine | 0.914mg | 1.206mg | 0% |
| Leucine | 1.613mg | 1.939mg | 0% |
| Lysine | 1.822mg | 1.025mg | 0% |
| Methionine | 0.587mg | 0.547mg | 0% |
| Phenylalanine | 0.775mg | 1.074mg | 0% |
| Valine | 1.022mg | 1.404mg | 0% |
| Histidine | 0.584mg | 0.547mg | 0% |
| Omega-3 - EPA | 0.321g | 0.01g | N/A |
| Omega-3 - DHA | 1.115g | 0.001g | N/A |
| Omega-3 - DPA | 0.287g | 0.017g | N/A |
| Omega-6 - Eicosadienoic acid | 0.007g | N/A |
Macronutrient Comparison
Macronutrient breakdown side-by-side comparison
Protein:
19.84 g
Fats:
6.34 g
Carbs:
0 g
Water:
68.5 g
Other:
5.32 g
Protein:
22.87 g
Fats:
33.31 g
Carbs:
3.09 g
Water:
37.02 g
Other:
3.71 g
| Contains more WaterWater | +85% |
| Contains more OtherOther | +43.4% |
| Contains more ProteinProtein | +15.3% |
| Contains more FatsFats | +425.4% |
| Contains more CarbsCarbs | +∞% |
Fat Type Comparison
Fat type breakdown side-by-side comparison
Saturated fat:
Sat. Fat
0.981 g
Monounsaturated fat:
Mono. Fat
2.103 g
Polyunsaturated fat:
Poly. Fat
2.539 g
Saturated fat:
Sat. Fat
18.867 g
Monounsaturated fat:
Mono. Fat
9.246 g
Polyunsaturated fat:
Poly. Fat
1.421 g
| Contains less Sat. FatSaturated fat | -94.8% |
| Contains more Poly. FatPolyunsaturated fat | +78.7% |
| Contains more Mono. FatMonounsaturated fat | +339.7% |