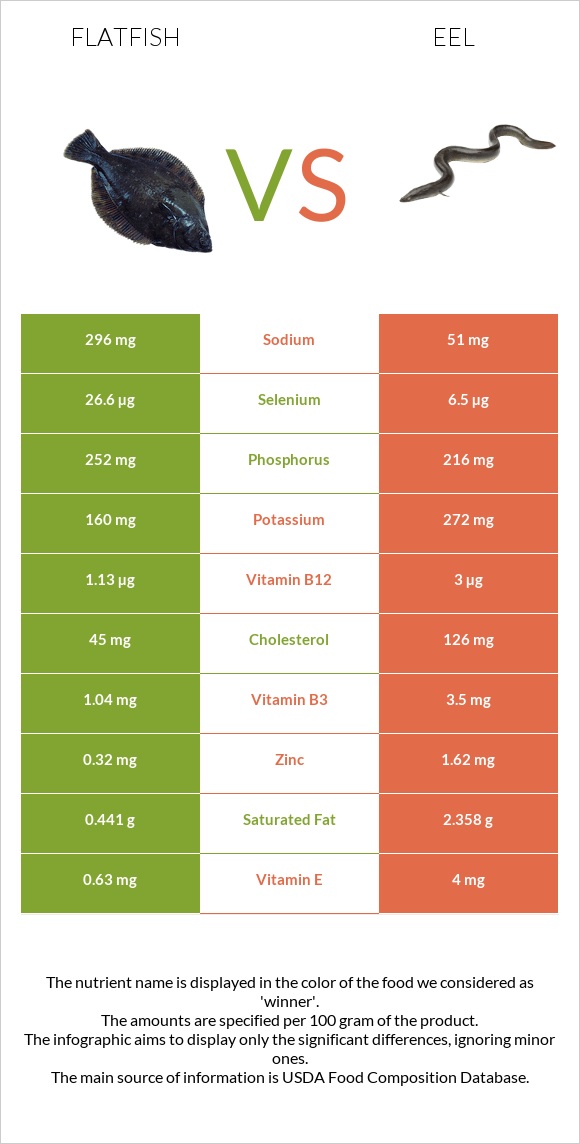
A recap on the differences between flatfish and eels Flatfish is higher in selenium, yet eels are higher in vitamin A, vitamin B12, vitamin B3, zinc, vitamin B1, and iron. Eels cover your daily vitamin A needs 75% more than flatfish. Flatfish contains 6 times more sodium than eels. While flatfish contains 363mg of sodium, eels contain only 65mg. Food varieties used in this article are Fish, flatfish (flounder and sole species), cooked, dry heat and Fish, eel, mixed species, cooked, dry heat .
Infographic
Mineral Comparison
Mineral comparison score is based on the number of minerals by which one or the other food is richer. The "coverage" charts below show how much of the daily needs can be covered by 300 grams of the food.
2
100 g
300 g
3 oz - 85g 1 fillet - 127g
Magnesium
Magnesium
Calcium
Calcium
Potassium
Potassium
Iron
Iron
Copper
Copper
Zinc
Zinc
Phosphorus
Phosphorus
Sodium
Sodium
Manganese
Manganese
Selenium
Selenium
16%
7.5%
17%
8.6%
7.7%
11%
132%
47%
2.2%
178%
7
100 g
300 g
1 cubic inch, boneless - 17g 1 oz with bone (yield after bone removed) - 22g 1 oz, boneless - 28.35g 3 oz - 85g 1 fillet - 159g
Magnesium
Magnesium
Calcium
Calcium
Potassium
Potassium
Iron
Iron
Copper
Copper
Zinc
Zinc
Phosphorus
Phosphorus
Sodium
Sodium
Manganese
Manganese
Selenium
Selenium
19%
7.8%
31%
24%
9.7%
57%
119%
8.5%
5.2%
45%
Vitamin Comparison
Vitamin comparison score is based on the number of vitamins by which one or the other food is richer. The "coverage" charts below show how much of the daily needs can be covered by 300 grams of the food.
4
100 g
300 g
3 oz - 85g 1 fillet - 127g
Vitamin C
Vit. C
Vitamin D
Vit. D
Vitamin A
Vit. A
Vitamin E
Vit. E
Vitamin B1
Vit. B1
Vitamin B2
Vit. B2
Vitamin B3
Vit. B3
Vitamin B5
Vit. B5
Vitamin B6
Vit. B6
Vitamin B12
Vit. B12
Vitamin K
Vit. K
Folate
Folate
0%
53%
4%
15%
6.5%
5.8%
24%
14%
27%
164%
0.25%
4.5%
8
100 g
300 g
1 cubic inch, boneless - 17g 1 oz with bone (yield after bone removed) - 22g 1 oz, boneless - 28.35g 3 oz - 85g 1 fillet - 159g
Vitamin C
Vit. C
Vitamin D
Vit. D
Vitamin A
Vit. A
Vitamin E
Vit. E
Vitamin B1
Vit. B1
Vitamin B2
Vit. B2
Vitamin B3
Vit. B3
Vitamin B5
Vit. B5
Vitamin B6
Vit. B6
Vitamin B12
Vit. B12
Vitamin K
Vit. K
Folate
Folate
6%
0%
379%
0%
46%
12%
84%
17%
18%
361%
0%
13%
All nutrients comparison - raw data values
Nutrient
DV% diff.
Vitamin A
12µg
1137µg
125%
Vitamin B12
1.31µg
2.89µg
66%
Selenium
32.6µg
8.3µg
44%
Cholesterol
56mg
161mg
35%
Monounsaturated fat
0.657g
9.218g
21%
Vitamin B3
1.278mg
4.487mg
20%
Fats
2.37g
14.95g
19%
Vitamin D
3.5µg
18%
Protein
15.24g
23.65g
17%
Vitamin D*
139 IU
17%
Zinc
0.39mg
2.08mg
15%
Choline
79.9mg
15%
Sodium
363mg
65mg
13%
Vitamin B1
0.026mg
0.183mg
13%
Saturated fat
0.542g
3.023g
11%
Calories
86kcal
236kcal
8%
Iron
0.23mg
0.64mg
5%
Phosphorus
309mg
277mg
5%
Vitamin E
0.77mg
5%
Polyunsaturated fat
0.459g
1.214g
5%
Potassium
197mg
349mg
4%
Vitamin B6
0.115mg
0.077mg
3%
Folate
6µg
17µg
3%
Vitamin C
0mg
1.8mg
2%
Vitamin B2
0.025mg
0.051mg
2%
Magnesium
22mg
26mg
1%
Copper
0.023mg
0.029mg
1%
Manganese
0.017mg
0.04mg
1%
Vitamin B5
0.227mg
0.28mg
1%
Protein per 100 calories
18g
10g
N/A
Calories per 10 g protein
56kcal
100kcal
N/A
Weight per 100 calories
116g
42g
N/A
Unsaturated / Saturated Fat ratio
2.1
3.5
N/A
Calcium
25mg
26mg
0%
Vitamin K
0.1µg
0%
Trans fat
0.014g
N/A
Tryptophan
0.197mg
0.265mg
0%
Threonine
0.719mg
1.037mg
0%
Isoleucine
0.754mg
1.09mg
0%
Leucine
1.335mg
1.922mg
0%
Lysine
1.561mg
2.171mg
0%
Methionine
0.56mg
0.7mg
0%
Phenylalanine
0.624mg
0.923mg
0%
Valine
0.8mg
1.218mg
0%
Histidine
0.374mg
0.696mg
0%
Omega-3 - EPA
0.168g
0.108g
N/A
Omega-3 - DHA
0.132g
0.081g
N/A
Omega-3 - DPA
0.034g
0.095g
N/A
Omega-6 - Eicosadienoic acid
0.006g
N/A
Macronutrient Comparison
Macronutrient breakdown side-by-side comparison
1
15%
2%
81%
Protein:
15.24 g
Fats:
2.37 g
Carbs:
0 g
Water:
81.11 g
Other:
1.28 g
3
24%
15%
59%
2%
Protein:
23.65 g
Fats:
14.95 g
Carbs:
0 g
Water:
59.31 g
Other:
2.09 g
Contains
more
Water Water
+36.8%
Contains
more
Protein Protein
+55.2%
Contains
more
Fats Fats
+530.8%
Contains
more
Other Other
+63.3%
Fat Type Comparison
Fat type breakdown side-by-side comparison
1
33%
40%
28%
Saturated fat:
Sat. Fat
0.542 g
Monounsaturated fat:
Mono. Fat
0.657 g
Polyunsaturated fat:
Poly. Fat
0.459 g
2
22%
69%
9%
Saturated fat:
Sat. Fat
3.023 g
Monounsaturated fat:
Mono. Fat
9.218 g
Polyunsaturated fat:
Poly. Fat
1.214 g
Contains
less
Sat. Fat Saturated fat
-82.1%
Contains
more
Mono. Fat Monounsaturated fat
+1303%
Contains
more
Poly. Fat Polyunsaturated fat
+164.5%