Game meat, boar, wild, raw vs. Pork Meat — In-Depth Nutrition Comparison
Compare
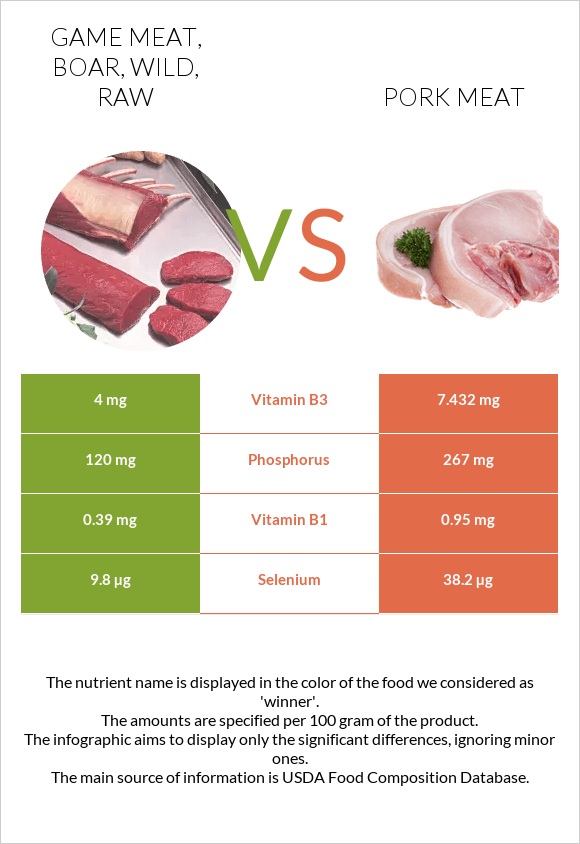
How are game meat, boar, wild, raw and pork Meat different?
- Pork Meat has more selenium, vitamin B1, vitamin B3, vitamin B2, and phosphorus than game meat, boar, wild, raw.
- Daily need coverage for selenium for pork Meat is 52% higher.
Game meat, boar, wild, raw and Pork, fresh, loin, tenderloin, separable lean only, cooked, roasted are the varieties used in this article.
Infographic
Infographic link
Mineral Comparison
Mineral comparison score is based on the number of minerals by which one or the other food is richer. The "coverage" charts below show how much of the daily needs can be covered by 300 grams of the food.
| Contains more CalciumCalcium | +100% |
| Contains less SodiumSodium | -100% |
| Contains more PhosphorusPhosphorus | +122.5% |
| Contains more SeleniumSelenium | +289.8% |
Vitamin Comparison
Vitamin comparison score is based on the number of vitamins by which one or the other food is richer. The "coverage" charts below show how much of the daily needs can be covered by 300 grams of the food.
| Contains more Vitamin B1Vitamin B1 | +143.6% |
| Contains more Vitamin B2Vitamin B2 | +251.8% |
| Contains more Vitamin B3Vitamin B3 | +85.8% |
All nutrients comparison - raw data values
| Nutrient |  |
 |
DV% diff. |
| Vitamin B6 | 0.739mg | 57% | |
| Selenium | 9.8µg | 38.2µg | 52% |
| Vitamin B1 | 0.39mg | 0.95mg | 47% |
| Cholesterol | 73mg | 24% | |
| Vitamin B12 | 0.57µg | 24% | |
| Zinc | 2.42mg | 22% | |
| Phosphorus | 120mg | 267mg | 21% |
| Vitamin B2 | 0.11mg | 0.387mg | 21% |
| Vitamin B3 | 4mg | 7.432mg | 21% |
| Vitamin B5 | 1.012mg | 20% | |
| Choline | 88.9mg | 16% | |
| Iron | 1.15mg | 14% | |
| Potassium | 421mg | 12% | |
| Copper | 0.111mg | 12% | |
| Protein | 21.51g | 26.17g | 9% |
| Magnesium | 29mg | 7% | |
| Sodium | 57mg | 2% | |
| Calories | 122kcal | 143kcal | 1% |
| Vitamin D* | 10 IU | 1% | |
| Vitamin D | 0.2µg | 1% | |
| Calcium | 12mg | 6mg | 1% |
| Vitamin E | 0.08mg | 1% | |
| Manganese | 0.013mg | 1% | |
| Saturated fat | 0.99g | 1.198g | 1% |
| Protein per 100 calories | 18g | 18g | N/A |
| Calories per 10 g protein | 57kcal | 55kcal | N/A |
| Weight per 100 calories | 82g | 70g | N/A |
| Fats | 3.33g | 3.51g | 0% |
| Unsaturated / Saturated Fat ratio | 1.8 | 1.5 | N/A |
| Trans fat | 0.033g | N/A | |
| Monounsaturated fat | 1.3g | 1.334g | 0% |
| Polyunsaturated fat | 0.48g | 0.506g | 0% |
| Tryptophan | 0.289mg | 0.275mg | 0% |
| Threonine | 1.012mg | 1.175mg | 0% |
| Isoleucine | 1.039mg | 1.288mg | 0% |
| Leucine | 1.748mg | 2.229mg | 0% |
| Lysine | 2.12mg | 2.427mg | 0% |
| Methionine | 0.53mg | 0.721mg | 0% |
| Phenylalanine | 0.86mg | 1.1mg | 0% |
| Valine | 1.153mg | 1.367mg | 0% |
| Histidine | 1.091mg | 1.13mg | 0% |
| Omega-3 - ALA | 0.013g | N/A | |
| Omega-6 - Eicosadienoic acid | 0.013g | N/A | |
| Omega-6 - Linoleic acid | 0.411g | N/A |
Macronutrient Comparison
Macronutrient breakdown side-by-side comparison
Protein:
21.51 g
Fats:
3.33 g
Carbs:
0 g
Water:
72.54 g
Other:
2.62 g
Protein:
26.17 g
Fats:
3.51 g
Carbs:
0 g
Water:
69.45 g
Other:
0.87 g
| Contains more OtherOther | +201.1% |
| Contains more ProteinProtein | +21.7% |
~equal in
Fats
~3.51g
~equal in
Carbs
~0g
~equal in
Water
~69.45g
Fat Type Comparison
Fat type breakdown side-by-side comparison
Saturated fat:
Sat. Fat
0.99 g
Monounsaturated fat:
Mono. Fat
1.3 g
Polyunsaturated fat:
Poly. Fat
0.48 g
Saturated fat:
Sat. Fat
1.198 g
Monounsaturated fat:
Mono. Fat
1.334 g
Polyunsaturated fat:
Poly. Fat
0.506 g
| Contains less Sat. FatSaturated fat | -17.4% |
~equal in
Monounsaturated fat
~1.334g
~equal in
Polyunsaturated fat
~0.506g