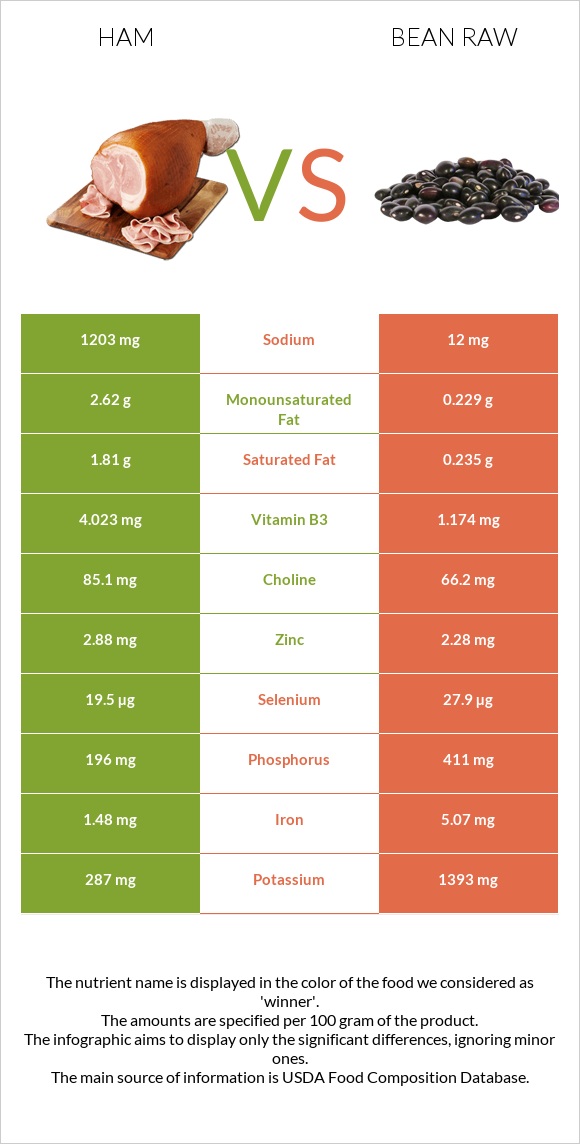
What are the main differences between ham and bean raw? Ham is richer in vitamin B12, yet bean raw is richer in folate, copper, fiber, manganese, iron, magnesium, potassium, and phosphorus. Bean raw's daily need coverage for folate is 131% higher. Bean raw contains less sodium. Ham has a lower glycemic index than bean raw. We used Pork, cured, ham, boneless, extra lean (approximately 5% fat), roasted and Beans, pinto, mature seeds, raw types in this comparison.
Infographic
Mineral Comparison
Mineral comparison score is based on the number of minerals by which one or the other food is richer. The "coverage" charts below show how much of the daily needs can be covered by 300 grams of the food.
1
100 g
300 g
3 oz - 85g 1 cup - 140g
Magnesium
Magnesium
Calcium
Calcium
Potassium
Potassium
Iron
Iron
Copper
Copper
Zinc
Zinc
Phosphorus
Phosphorus
Sodium
Sodium
Manganese
Manganese
Selenium
Selenium
10%
2.4%
25%
56%
26%
79%
84%
157%
7%
106%
9
100 g
300 g
1 tbsp - 12g 1 cup - 193g
Magnesium
Magnesium
Calcium
Calcium
Potassium
Potassium
Iron
Iron
Copper
Copper
Zinc
Zinc
Phosphorus
Phosphorus
Sodium
Sodium
Manganese
Manganese
Selenium
Selenium
126%
34%
123%
190%
298%
62%
176%
1.6%
150%
152%
Vitamin Comparison
Vitamin comparison score is based on the number of vitamins by which one or the other food is richer. The "coverage" charts below show how much of the daily needs can be covered by 300 grams of the food.
4
100 g
300 g
3 oz - 85g 1 cup - 140g
Vitamin C
Vit. C
Vitamin D
Vit. D
Vitamin A
Vit. A
Vitamin E
Vit. E
Vitamin B1
Vit. B1
Vitamin B2
Vit. B2
Vitamin B3
Vit. B3
Vitamin B5
Vit. B5
Vitamin B6
Vit. B6
Vitamin B12
Vit. B12
Vitamin K
Vit. K
Folate
Folate
0%
12%
0%
5%
189%
47%
75%
24%
92%
81%
0%
2.3%
5
100 g
300 g
1 tbsp - 12g 1 cup - 193g
Vitamin C
Vit. C
Vitamin D
Vit. D
Vitamin A
Vit. A
Vitamin E
Vit. E
Vitamin B1
Vit. B1
Vitamin B2
Vit. B2
Vitamin B3
Vit. B3
Vitamin B5
Vit. B5
Vitamin B6
Vit. B6
Vitamin B12
Vit. B12
Vitamin K
Vit. K
Folate
Folate
21%
0%
0%
4.2%
178%
49%
22%
47%
109%
0%
14%
394%
All nutrients comparison - raw data values
Nutrient
DV% diff.
Folate
3µg
525µg
131%
Copper
0.079mg
0.893mg
90%
Fiber
0g
15.5g
62%
Sodium
1203mg
12mg
52%
Manganese
0.054mg
1.148mg
48%
Iron
1.48mg
5.07mg
45%
Magnesium
14mg
176mg
39%
Potassium
287mg
1393mg
33%
Phosphorus
196mg
411mg
31%
Vitamin B12
0.65µg
0µg
27%
Carbs
1.5g
62.55g
20%
Cholesterol
53mg
0mg
18%
Vitamin B3
4.023mg
1.174mg
18%
Selenium
19.5µg
27.9µg
15%
Starch
34.17g
14%
Calcium
8mg
113mg
11%
Calories
145kcal
347kcal
10%
Vitamin B5
0.403mg
0.785mg
8%
Fats
5.53g
1.23g
7%
Vitamin C
0mg
6.3mg
7%
Saturated fat
1.81g
0.235g
7%
Vitamin B6
0.4mg
0.474mg
6%
Monounsaturated fat
2.62g
0.229g
6%
Zinc
2.88mg
2.28mg
5%
Vitamin K
0µg
5.6µg
5%
Vitamin D*
32 IU
0 IU
4%
Vitamin D
0.8µg
0µg
4%
Vitamin B1
0.754mg
0.713mg
3%
Choline
85.1mg
66.2mg
3%
Protein
20.93g
21.42g
1%
Vitamin B2
0.202mg
0.212mg
1%
Polyunsaturated fat
0.54g
0.407g
1%
Protein per 100 calories
14g
6.2g
N/A
Calories per 10 g protein
69kcal
162kcal
N/A
Weight per 100 calories
69g
29g
N/A
Unsaturated / Saturated Fat ratio
1.7
2.7
N/A
Net carbs
1.5g
47.05g
N/A
Sugar
0g
2.11g
N/A
Vitamin E
0.25mg
0.21mg
0%
Tryptophan
0.251mg
0.237mg
0%
Threonine
0.931mg
0.81mg
0%
Isoleucine
0.918mg
0.871mg
0%
Leucine
1.661mg
1.558mg
0%
Lysine
1.775mg
1.356mg
0%
Methionine
0.553mg
0.259mg
0%
Phenylalanine
0.904mg
1.095mg
0%
Valine
0.908mg
0.998mg
0%
Histidine
0.75mg
0.556mg
0%
Macronutrient Comparison
Macronutrient breakdown side-by-side comparison
3
21%
6%
68%
4%
Protein:
20.93 g
Fats:
5.53 g
Carbs:
1.5 g
Water:
67.67 g
Other:
4.37 g
2
21%
63%
11%
3%
Protein:
21.42 g
Fats:
1.23 g
Carbs:
62.55 g
Water:
11.33 g
Other:
3.47 g
Contains
more
Fats Fats
+349.6%
Contains
more
Water Water
+497.3%
Contains
more
Other Other
+25.9%
Contains
more
Carbs Carbs
+4070%
~equal in
Protein
~21.42g
Fat Type Comparison
Fat type breakdown side-by-side comparison
2
36%
53%
11%
Saturated fat:
Sat. Fat
1.81 g
Monounsaturated fat:
Mono. Fat
2.62 g
Polyunsaturated fat:
Poly. Fat
0.54 g
1
27%
26%
47%
Saturated fat:
Sat. Fat
0.235 g
Monounsaturated fat:
Mono. Fat
0.229 g
Polyunsaturated fat:
Poly. Fat
0.407 g
Contains
more
Mono. Fat Monounsaturated fat
+1044.1%
Contains
more
Poly. Fat Polyunsaturated fat
+32.7%
Contains
less
Sat. Fat Saturated fat
-87%