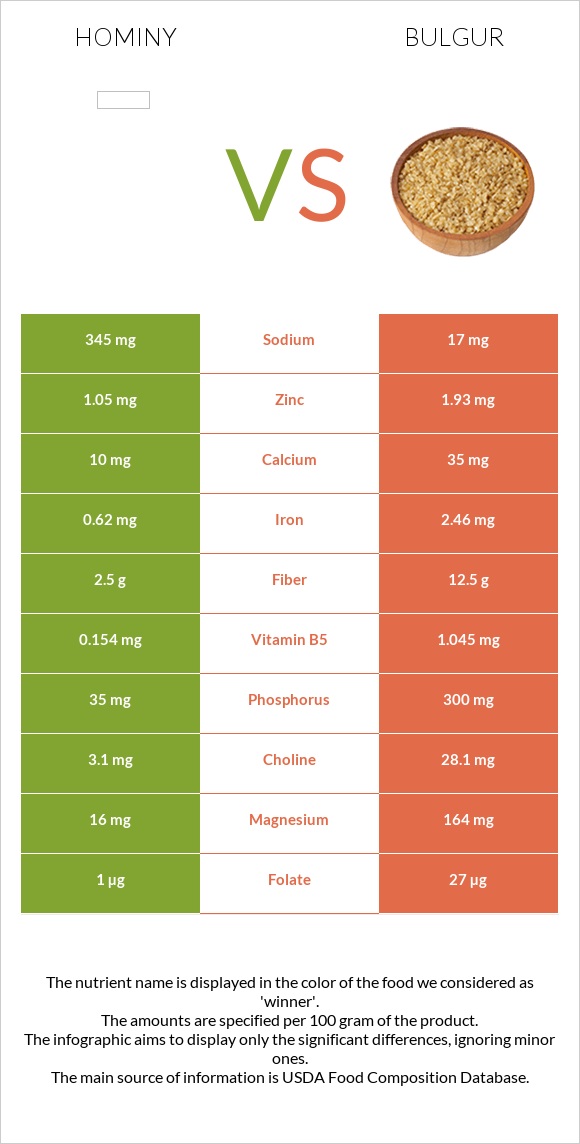
Summary of differences between hominy and bulgur The amount of manganese, fiber, vitamin B3, vitamin B6, and copper in bulgur is higher than in hominy. Bulgur covers your daily need for manganese, 23% more than hominy. Hominy contains 69 times more sodium than bulgur. While hominy contains 345mg of sodium, bulgur contains only 5mg. These are the specific foods used in this comparison Hominy, canned, white and Bulgur, cooked .
Infographic
Mineral Comparison
Mineral comparison score is based on the number of minerals by which one or the other food is richer. The "coverage" charts below show how much of the daily needs can be covered by 300 grams of the food.
2
100 g
300 g
1 cup - 165g
Magnesium
Magnesium
Calcium
Calcium
Potassium
Potassium
Iron
Iron
Copper
Copper
Zinc
Zinc
Phosphorus
Phosphorus
Sodium
Sodium
Manganese
Manganese
Selenium
Selenium
11%
3%
0.79%
23%
10%
29%
15%
45%
9.1%
16%
7
100 g
300 g
1 tbsp - 8.4g 1 cup - 182g
Magnesium
Magnesium
Calcium
Calcium
Potassium
Potassium
Iron
Iron
Copper
Copper
Zinc
Zinc
Phosphorus
Phosphorus
Sodium
Sodium
Manganese
Manganese
Selenium
Selenium
23%
3%
6%
36%
25%
16%
17%
0.65%
79%
3.3%
Vitamin Comparison
Vitamin comparison score is based on the number of vitamins by which one or the other food is richer. The "coverage" charts below show how much of the daily needs can be covered by 300 grams of the food.
1
100 g
300 g
1 cup - 165g
Vitamin C
Vit. C
Vitamin D
Vit. D
Vitamin A
Vit. A
Vitamin E
Vit. E
Vitamin B1
Vit. B1
Vitamin B2
Vit. B2
Vitamin B3
Vit. B3
Vitamin B5
Vit. B5
Vitamin B6
Vit. B6
Vitamin B12
Vit. B12
Vitamin K
Vit. K
Folate
Folate
0%
0%
0%
1%
0.75%
1.4%
0.62%
9.2%
1.2%
0%
0.5%
0.75%
7
100 g
300 g
1 tbsp - 8.4g 1 cup - 182g
Vitamin C
Vit. C
Vitamin D
Vit. D
Vitamin A
Vit. A
Vitamin E
Vit. E
Vitamin B1
Vit. B1
Vitamin B2
Vit. B2
Vitamin B3
Vit. B3
Vitamin B5
Vit. B5
Vitamin B6
Vit. B6
Vitamin B12
Vit. B12
Vitamin K
Vit. K
Folate
Folate
0%
0%
0%
0.2%
14%
6.5%
19%
21%
19%
0%
1.3%
14%
All nutrients comparison - raw data values
Nutrient
DV% diff.
Manganese
0.07mg
0.609mg
23%
Sodium
345mg
5mg
15%
Fiber
2.5g
4.5g
8%
Vitamin B3
0.033mg
1mg
6%
Vitamin B6
0.005mg
0.083mg
6%
Copper
0.03mg
0.075mg
5%
Vitamin B1
0.003mg
0.057mg
5%
Magnesium
16mg
32mg
4%
Iron
0.62mg
0.96mg
4%
Zinc
1.05mg
0.57mg
4%
Selenium
3µg
0.6µg
4%
Vitamin B5
0.154mg
0.344mg
4%
Folate
1µg
18µg
4%
Protein
1.48g
3.08g
3%
Potassium
9mg
68mg
2%
Vitamin B2
0.006mg
0.028mg
2%
Polyunsaturated fat
0.399g
0.098g
2%
Calories
72kcal
83kcal
1%
Fats
0.88g
0.24g
1%
Carbs
14.26g
18.58g
1%
Phosphorus
35mg
40mg
1%
Choline
3.1mg
6.9mg
1%
Monounsaturated fat
0.231g
0.031g
1%
Protein per 100 calories
2.1g
3.7g
N/A
Calories per 10 g protein
486kcal
269kcal
N/A
Weight per 100 calories
139g
120g
N/A
Net carbs
11.76g
14.08g
N/A
Calcium
10mg
10mg
0%
Sugar
1.82g
0.1g
N/A
Vitamin E
0.05mg
0.01mg
0%
Vitamin K
0.2µg
0.5µg
0%
Saturated fat
0.123g
0.042g
0%
Tryptophan
0.008mg
0.048mg
0%
Threonine
0.05mg
0.089mg
0%
Isoleucine
0.058mg
0.114mg
0%
Leucine
0.202mg
0.208mg
0%
Lysine
0.033mg
0.085mg
0%
Methionine
0.031mg
0.048mg
0%
Phenylalanine
0.076mg
0.145mg
0%
Valine
0.077mg
0.139mg
0%
Histidine
0.045mg
0.071mg
0%
Macronutrient Comparison
Macronutrient breakdown side-by-side comparison
3
14%
83%
Protein:
1.48 g
Fats:
0.88 g
Carbs:
14.26 g
Water:
82.53 g
Other:
0.85 g
2
3%
19%
78%
Protein:
3.08 g
Fats:
0.24 g
Carbs:
18.58 g
Water:
77.76 g
Other:
0.34 g
Contains
more
Fats Fats
+266.7%
Contains
more
Other Other
+150%
Contains
more
Protein Protein
+108.1%
Contains
more
Carbs Carbs
+30.3%
Fat Type Comparison
Fat type breakdown side-by-side comparison
2
16%
31%
53%
Saturated fat:
Sat. Fat
0.123 g
Monounsaturated fat:
Mono. Fat
0.231 g
Polyunsaturated fat:
Poly. Fat
0.399 g
1
25%
18%
57%
Saturated fat:
Sat. Fat
0.042 g
Monounsaturated fat:
Mono. Fat
0.031 g
Polyunsaturated fat:
Poly. Fat
0.098 g
Contains
more
Mono. Fat Monounsaturated fat
+645.2%
Contains
more
Poly. Fat Polyunsaturated fat
+307.1%
Contains
less
Sat. Fat Saturated fat
-65.9%