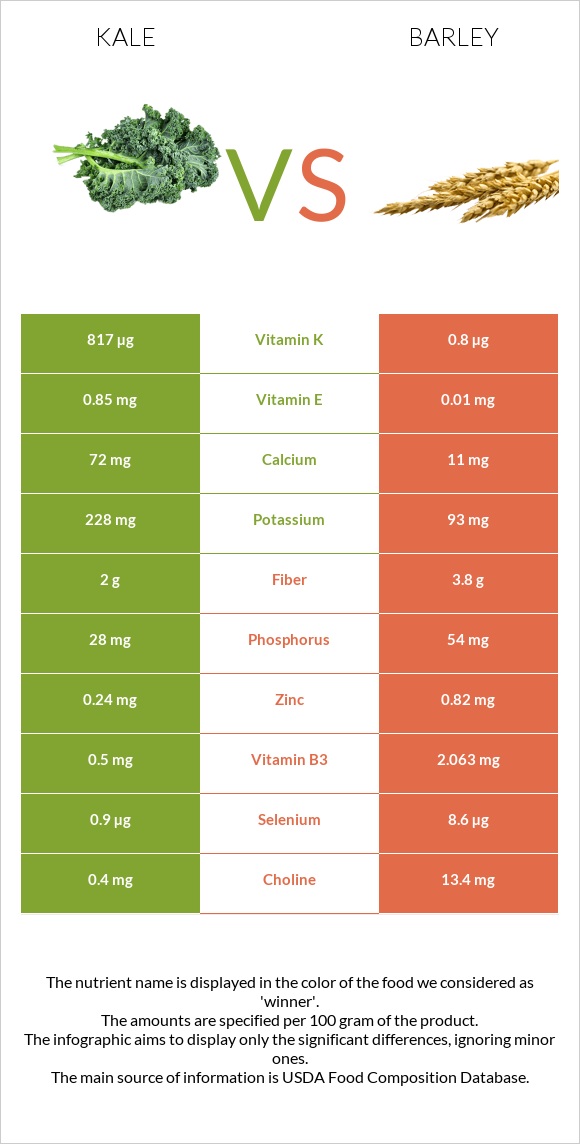
Significant differences between kale and barley Kale has more vitamin K, vitamin A, vitamin C, manganese, calcium, copper, and vitamin E; however, barley is richer in selenium, vitamin B3, and fiber. Kale covers your daily vitamin K needs 680% more than barley. Specific food types used in this comparison are Kale, cooked, boiled, drained, without salt and Barley, pearled, cooked .
Infographic
Mineral Comparison
Mineral comparison score is based on the number of minerals by which one or the other food is richer. The "coverage" charts below show how much of the daily needs can be covered by 300 grams of the food.
4
100 g
300 g
1 cup, chopped - 130g
Magnesium
Magnesium
Calcium
Calcium
Potassium
Potassium
Iron
Iron
Copper
Copper
Zinc
Zinc
Phosphorus
Phosphorus
Sodium
Sodium
Manganese
Manganese
Selenium
Selenium
13%
22%
20%
34%
52%
6.5%
12%
3%
54%
4.9%
6
100 g
300 g
1 cup - 157g
Magnesium
Magnesium
Calcium
Calcium
Potassium
Potassium
Iron
Iron
Copper
Copper
Zinc
Zinc
Phosphorus
Phosphorus
Sodium
Sodium
Manganese
Manganese
Selenium
Selenium
16%
3.3%
8.2%
50%
35%
22%
23%
0.39%
34%
47%
Vitamin Comparison
Vitamin comparison score is based on the number of vitamins by which one or the other food is richer. The "coverage" charts below show how much of the daily needs can be covered by 300 grams of the food.
6
100 g
300 g
1 cup, chopped - 130g
Vitamin C
Vit. C
Vitamin D
Vit. D
Vitamin A
Vit. A
Vitamin E
Vit. E
Vitamin B1
Vit. B1
Vitamin B2
Vit. B2
Vitamin B3
Vit. B3
Vitamin B5
Vit. B5
Vitamin B6
Vit. B6
Vitamin B12
Vit. B12
Vitamin K
Vit. K
Folate
Folate
137%
0%
227%
17%
13%
16%
9.4%
2.9%
32%
0%
2043%
9.8%
4
100 g
300 g
1 cup - 157g
Vitamin C
Vit. C
Vitamin D
Vit. D
Vitamin A
Vit. A
Vitamin E
Vit. E
Vitamin B1
Vit. B1
Vitamin B2
Vit. B2
Vitamin B3
Vit. B3
Vitamin B5
Vit. B5
Vitamin B6
Vit. B6
Vitamin B12
Vit. B12
Vitamin K
Vit. K
Folate
Folate
0%
0%
0%
0.2%
21%
14%
39%
8.1%
27%
0%
2%
12%
All nutrients comparison - raw data values
Nutrient
DV% diff.
Vitamin K
817µg
0.8µg
680%
Vitamin A
681µg
0µg
76%
Vitamin C
41mg
0mg
46%
Selenium
0.9µg
8.6µg
14%
Vitamin B3
0.5mg
2.063mg
10%
Carbs
5.63g
28.22g
8%
Fiber
2g
3.8g
7%
Manganese
0.416mg
0.259mg
7%
Calcium
72mg
11mg
6%
Copper
0.156mg
0.105mg
6%
Vitamin E
0.85mg
0.01mg
6%
Calories
28kcal
123kcal
5%
Iron
0.9mg
1.33mg
5%
Zinc
0.24mg
0.82mg
5%
Potassium
228mg
93mg
4%
Phosphorus
28mg
54mg
4%
Vitamin B1
0.053mg
0.083mg
3%
Vitamin B5
0.049mg
0.135mg
2%
Vitamin B6
0.138mg
0.115mg
2%
Choline
0.4mg
13.4mg
2%
Protein
1.9g
2.26g
1%
Magnesium
18mg
22mg
1%
Sodium
23mg
3mg
1%
Vitamin B2
0.07mg
0.062mg
1%
Folate
13µg
16µg
1%
Protein per 100 calories
6.8g
1.8g
N/A
Calories per 10 g protein
147kcal
544kcal
N/A
Weight per 100 calories
357g
81g
N/A
Fats
0.4g
0.44g
0%
Net carbs
3.63g
24.42g
N/A
Sugar
1.25g
0.28g
N/A
Saturated fat
0.052g
0.093g
0%
Monounsaturated fat
0.03g
0.057g
0%
Polyunsaturated fat
0.193g
0.214g
0%
Tryptophan
0.023mg
0.038mg
0%
Threonine
0.085mg
0.077mg
0%
Isoleucine
0.114mg
0.083mg
0%
Leucine
0.133mg
0.154mg
0%
Lysine
0.114mg
0.084mg
0%
Methionine
0.018mg
0.043mg
0%
Phenylalanine
0.097mg
0.127mg
0%
Valine
0.104mg
0.111mg
0%
Histidine
0.04mg
0.051mg
0%
Macronutrient Comparison
Macronutrient breakdown side-by-side comparison
2
2%
6%
91%
Protein:
1.9 g
Fats:
0.4 g
Carbs:
5.63 g
Water:
91.2 g
Other:
0.87 g
3
2%
28%
69%
Protein:
2.26 g
Fats:
0.44 g
Carbs:
28.22 g
Water:
68.8 g
Other:
0.28 g
Contains
more
Water Water
+32.6%
Contains
more
Other Other
+210.7%
Contains
more
Protein Protein
+18.9%
Contains
more
Carbs Carbs
+401.2%
Fat Type Comparison
Fat type breakdown side-by-side comparison
1
19%
11%
70%
Saturated fat:
Sat. Fat
0.052 g
Monounsaturated fat:
Mono. Fat
0.03 g
Polyunsaturated fat:
Poly. Fat
0.193 g
2
26%
16%
59%
Saturated fat:
Sat. Fat
0.093 g
Monounsaturated fat:
Mono. Fat
0.057 g
Polyunsaturated fat:
Poly. Fat
0.214 g
Contains
less
Sat. Fat Saturated fat
-44.1%
Contains
more
Mono. Fat Monounsaturated fat
+90%
Contains
more
Poly. Fat Polyunsaturated fat
+10.9%