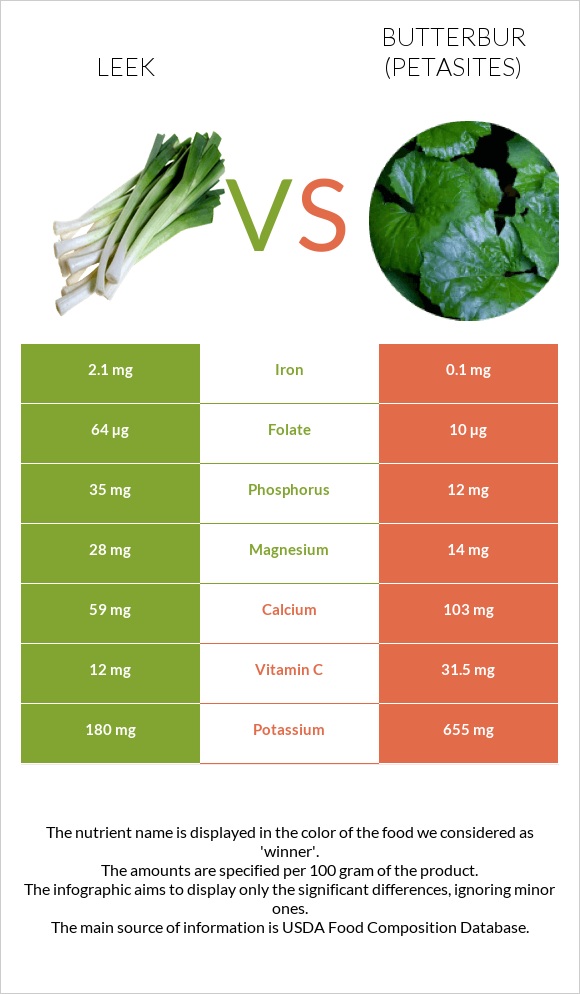
Important differences between leeks and butterbur Leeks have more vitamin A, iron, folate, vitamin B6, and manganese; however, butterbur has more vitamin C and potassium. Leeks' daily need coverage for vitamin A is 32% more. Leeks have 21 times more iron than butterbur. Leeks have 2.1mg of iron, while butterbur has 0.1mg. The food varieties used in the comparison are Leeks, (bulb and lower leaf-portion), raw and Butterbur, (fuki), raw .
Infographic
Mineral Comparison
Mineral comparison score is based on the number of minerals by which one or the other food is richer. The "coverage" charts below show how much of the daily needs can be covered by 300 grams of the food.
5
100 g
300 g
1 slice - 6g 1 cup - 89g 1 leek - 89g
Magnesium
Magnesium
Calcium
Calcium
Potassium
Potassium
Iron
Iron
Copper
Copper
Zinc
Zinc
Phosphorus
Phosphorus
Sodium
Sodium
Manganese
Manganese
Selenium
Selenium
20%
18%
16%
79%
40%
3.3%
15%
2.6%
63%
5.5%
4
100 g
300 g
1 petiole - 5g 1 cup - 94g
Magnesium
Magnesium
Calcium
Calcium
Potassium
Potassium
Iron
Iron
Copper
Copper
Zinc
Zinc
Phosphorus
Phosphorus
Sodium
Sodium
Manganese
Manganese
Selenium
Selenium
10%
31%
58%
3.8%
34%
4.4%
5.1%
0.91%
36%
4.9%
Vitamin Comparison
Vitamin comparison score is based on the number of vitamins by which one or the other food is richer. The "coverage" charts below show how much of the daily needs can be covered by 300 grams of the food.
9
100 g
300 g
1 slice - 6g 1 cup - 89g 1 leek - 89g
Vitamin C
Vit. C
Vitamin D
Vit. D
Vitamin A
Vit. A
Vitamin E
Vit. E
Vitamin B1
Vit. B1
Vitamin B2
Vit. B2
Vitamin B3
Vit. B3
Vitamin B5
Vit. B5
Vitamin B6
Vit. B6
Vitamin B12
Vit. B12
Vitamin K
Vit. K
Folate
Folate
40%
0%
28%
18%
15%
6.9%
7.5%
8.4%
54%
0%
118%
48%
1
100 g
300 g
1 petiole - 5g 1 cup - 94g
Vitamin C
Vit. C
Vitamin D
Vit. D
Vitamin A
Vit. A
Vitamin E
Vit. E
Vitamin B1
Vit. B1
Vitamin B2
Vit. B2
Vitamin B3
Vit. B3
Vitamin B5
Vit. B5
Vitamin B6
Vit. B6
Vitamin B12
Vit. B12
Vitamin K
Vit. K
Folate
Folate
105%
0%
1%
0%
5%
4.6%
3.8%
1.9%
22%
0%
0%
7.5%
All nutrients comparison - raw data values
Nutrient
DV% diff.
Vitamin K
47µg
39%
Iron
2.1mg
0.1mg
25%
Vitamin C
12mg
31.5mg
22%
Potassium
180mg
655mg
14%
Folate
64µg
10µg
14%
Vitamin B6
0.233mg
0.096mg
11%
Vitamin A
83µg
3µg
9%
Manganese
0.481mg
0.274mg
9%
Fiber
1.8g
7%
Vitamin E
0.92mg
6%
Carbs
14.15g
3.61g
4%
Calcium
59mg
103mg
4%
Magnesium
28mg
14mg
3%
Phosphorus
35mg
12mg
3%
Vitamin B1
0.06mg
0.02mg
3%
Calories
61kcal
14kcal
2%
Protein
1.5g
0.39g
2%
Copper
0.12mg
0.103mg
2%
Vitamin B5
0.14mg
0.032mg
2%
Choline
9.5mg
2%
Sodium
20mg
7mg
1%
Vitamin B2
0.03mg
0.02mg
1%
Vitamin B3
0.4mg
0.2mg
1%
Polyunsaturated fat
0.166g
1%
Protein per 100 calories
2.5g
2.8g
N/A
Calories per 10 g protein
407kcal
359kcal
N/A
Weight per 100 calories
164g
714g
N/A
Fats
0.3g
0.04g
0%
Net carbs
12.35g
3.61g
N/A
Sugar
3.9g
N/A
Zinc
0.12mg
0.16mg
0%
Selenium
1µg
0.9µg
0%
Saturated fat
0.04g
0%
Monounsaturated fat
0.004g
0%
Tryptophan
0.012mg
0%
Threonine
0.063mg
0%
Isoleucine
0.052mg
0%
Leucine
0.096mg
0%
Lysine
0.078mg
0%
Methionine
0.018mg
0%
Phenylalanine
0.055mg
0%
Valine
0.056mg
0%
Histidine
0.025mg
0%
Macronutrient Comparison
Macronutrient breakdown side-by-side comparison
3
14%
83%
Protein:
1.5 g
Fats:
0.3 g
Carbs:
14.15 g
Water:
83 g
Other:
1.05 g
2
4%
95%
Protein:
0.39 g
Fats:
0.04 g
Carbs:
3.61 g
Water:
94.5 g
Other:
1.46 g
Contains
more
Protein Protein
+284.6%
Contains
more
Fats Fats
+650%
Contains
more
Carbs Carbs
+292%
Contains
more
Water Water
+13.9%
Contains
more
Other Other
+39%