Millet vs. Buckwheat — Health Impact and Nutrition Comparison


Summary
Millet is high in net carbs, protein, fats, phosphorus, zinc, and copper. Millet also contains more vitamins B1, B2, B3, B6, and folate. On the other hand, buckwheat has higher magnesium, choline, selenium, iron, potassium, calcium, manganese, dietary fiber, and vitamins B5, E, and K. Millet has less sodium, oxalate, and saturated fats, whereas buckwheat has fewer calories.
Introduction
This article will compare millet and buckwheat's nutritional values and health impact.
Buckwheat originated in Southeast Asia and then spread throughout Asia and into Europe. Millets come from different parts of Africa and Asia.
Classification
Buckwheat is not related to wheat, despite its name. Buckwheat (Fagopyrum esculentum) is a pseudocereal and belongs to the family Polygonaceae and the genus Fagopyrum.
Millet belongs to the Poaceae family and the genus Panicum.
Varieties
Buckwheat comes in three common varieties: common buckwheat (Fagopyrum esculentum), Tartary buckwheat (Fagopyrum tataricum), and perennial buckwheat (Fagopyrum cymosum).
Pearl millet, proso millet, finger millet, and foxtail millet are common millet types.
Appearance
Buckwheat groats are tiny, angular, and triangular-shaped hulled seeds of the buckwheat plant. They are usually a pale green tint, although this might vary according to the type. Buckwheat groats have a slightly mushy texture and a deeper color when cooked, ranging from light tan to a deep, rich brown.
The color and size of millet grains vary depending on the variety. Pearl millet has spherical, pale yellow grains. Proso millet, on the other hand, has smaller, rounder grains that are white or pale yellow. The grains of finger millet are small and reddish-brown in hue. Foxtail millet grains are small, spherical, and yellow, with a distinctive tail-like shape.
Taste and Use
Millet has a nutty and slightly sweet flavor with an earthy undertone. It's often compared to the taste of corn. Buckwheat, on the other hand, has a robust, rich, and slightly tangy flavor.
Cooked milled have a somewhat creamy or buttery texture. Depending on the type, millet's flavor profile might differ; some may taste more pronouncedly nuttily, while others may taste sweeter. Buckwheat's flavor profile varies depending on its form. Raw buckwheat groats have a more delicate flavor, whereas roasted buckwheat has a robust flavor.
Millet is a staple food in various countries across Africa and Asia. It can be used for both sweet and savory dishes. You can cook as a whole grain or make traditional alcoholic drinks such as beer and spirits. Millet is also used in health food products like cereal, granola bars, and snacks. Millet flour is used in gluten-free baking to produce bread, cakes, cookies, and muffins.
Buckwheat is versatile and can be used in various recipes such as salads, side dishes, or pilafs. You can use buckwheat flour for making noodles or pancakes. Buckwheat is also used in beer production.
Nutrition
In this part of the article, we will compare the nutritional information of millet and buckwheat.
Macronutrients and Calories
Millet is high in macronutrients and is denser compared to buckwheat. Millet has 71% water, whereas buckwheat provides 76%.
Macronutrient Comparison
Contains
more
FatsFats
+61.3%
Contains
more
CarbsCarbs
+18.7%
Calories
Compared to buckwheat, millet has more calories per hundred grams. A hundred grams of millet provides 119 calories, whereas buckwheat has 92 calories. One serving of millet (1 cup or 174g ) provides 207 kcal, whereas one serving of buckwheat (1 cup or 168g) has 155 kcal.
Protein
Compared to buckwheat, millet is slightly higher in protein. A hundred grams of millet provides 3.51g of protein, whereas buckwheat has 3.38g. Both contain all essential amino acids. Millet provides more isoleucine, leucine, methionine, phenylalanine, and valine. In contrast, buckwheat is high in tryptophan, threonine, lysine, and histidine.
Millet and buckwheat are gluten-free (1, 2).
Fats
Millet and buckwheat have small amounts of fat. In a 100g serving, millet and buckwheat contain 1g and 0.62g of fat, respectively. Buckwheat provides slightly more monounsaturated fat, whereas millet has more polyunsaturated fat and less saturated fat.
Fat Type Comparison
Contains
more
Poly. FatPolyunsaturated fat
+170.2%
Contains
less
Sat. FatSaturated fat
-22.1%
Carbohydrates
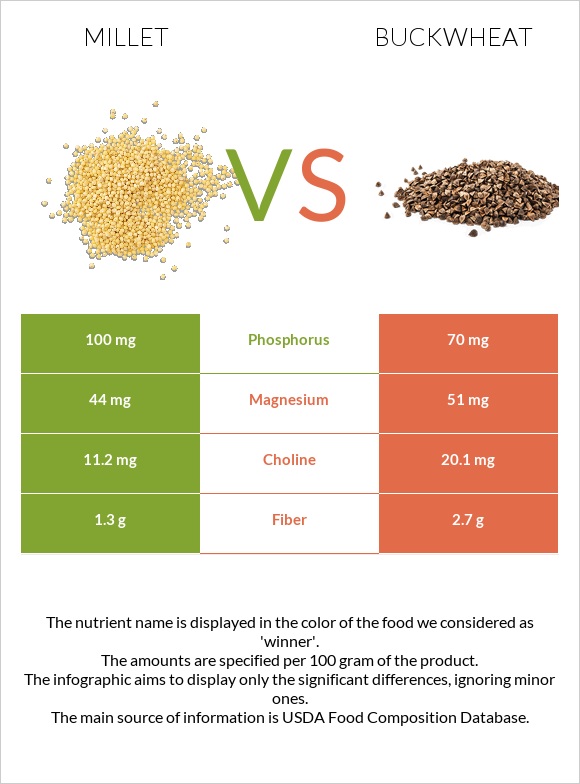
Millet and buckwheat are high in carbohydrates, millet being higher. In a 100g serving, millet and buckwheat contain 23.67g and 19.94g of carbs, respectively. In addition, millet is high in net carbs, whereas buckwheat has high fiber content. In a 100g serving, millet and buckwheat contain 22.37g and 17.24g of net carbs, respectively. The dietary fiber content for millet and buckwheat is 1.3g and 2.7g, respectively.
Vitamins
Millet provides more vitamins B1 (thiamine), B2 (riboflavin), B3 (niacin), B6 (pyridoxine), and folate. Millet also contains small amounts of vitamin A (3IU), whereas buckwheat lacks vitamin A. Buckwheat has over two times more vitamin B5, six times more vitamin K, and 4.5 times more vitamin E. Neither contain vitamin C or vitamin D.
Vitamin Comparison
Contains
more
Vitamin B1Vitamin B1
+165%
Contains
more
Vitamin B2Vitamin B2
+110.3%
Contains
more
Vitamin B3Vitamin B3
+41.5%
Contains
more
Vitamin B6Vitamin B6
+40.3%
Contains
more
FolateFolate
+35.7%
Contains
more
Vitamin EVitamin E
+350%
Contains
more
Vitamin B5Vitamin B5
+109.9%
Contains
more
Vitamin KVitamin K
+533.3%
Minerals
Millet has more phosphorus, zinc, and copper. On the other hand, buckwheat is high in magnesium, potassium, calcium, choline, selenium, iron, and manganese. Moreover, millet has two times less sodium. A hundred grams of millet has 2 mg of sodium, whereas buckwheat provides 4 mg.
Mineral Comparison
Contains
more
ZincZinc
+49.2%
Contains
more
PhosphorusPhosphorus
+42.9%
Contains
less
SodiumSodium
-50%
Contains
more
MagnesiumMagnesium
+15.9%
Contains
more
CalciumCalcium
+133.3%
Contains
more
PotassiumPotassium
+41.9%
Contains
more
IronIron
+27%
Contains
more
ManganeseManganese
+48.2%
Contains
more
SeleniumSelenium
+144.4%
Oxalate content
Compared to millet, buckwheat has over ten times more oxalate content. The oxalate value of millet is 13mg, whereas buckwheat has an oxalate level of 133mg.
Cholesterol
Millet and buckwheat are cholesterol-free.
Glycemic Index
Millet has a glycemic index of 71±10. The glycemic index of buckwheat is 51±10. That shows that millet is high-GI food, whereas buckwheat is low-GI food.
You can access our extensive glycemic index chart that contains information on over 600 foods.
Acidity
The PRAL value indicates the food's capacity to degrade into bases or acids within the body. Millet has a PRAL level of 2.9, whereas the PRAL value of buckwheat is 1. Both are acidic, millet being more acid-forming.
Weight Loss & Diets
Vegan: Vegans can use buckwheat and millet in their diet, as they are made entirely of plants and don't contain any animal ingredients.
Vegetarian: Vegetarians avoid all animal flesh products. Vegetarians can use both of them.
Paleo: Eating natural, unprocessed foods and staying away from processed foods are the main goals of the paleo diet. As buckwheat is a pseudocereal, it can be part of the paleo diet, whereas millet is not paleo-friendly.
Keto: The keto diet includes low-carb, high-fat, and high-protein foods. Because of their high carb content, both are not keto-friendly.
DASH: Whole grains like millet, buckwheat, rice, and amaranth are allowed in the DASH diet.
Health Benefits
Cardiovascular Health
Buckwheat consumption may reduce some CVD risk factors (3).
Based on findings, consuming buckwheat is linked to statistically substantially reduced amounts of triglycerides and total cholesterol compared to control arms. Nevertheless, neither HDL nor LDL cholesterol was significantly affected by buckwheat consumption (4).
Consuming millet is linked to several health benefits, such as controlling blood pressure and protection against cardiovascular and cancer diseases (5).
Foxtail and proso millet may prevent cardiovascular disease by lowering plasma triglycerides in hyperlipidemic rats (6).
Buckwheat contains antioxidants, particularly rutin. Rutin's therapeutic and biological activities include increased blood vessel elasticity, effectiveness against circulatory problems, atherosclerosis, antioxidant properties, antiinflammation, antihypertension, vasoconstrictive, spasmolytic, cholesterol reduction, and protection against oxidative stress (7).
Diabetes
Based on the findings, buckwheat consumption may enhance insulin resistance and lipid profile in DM type 2 patients.
Furthermore, subgroup studies on the daily dosage of buckwheat consumption revealed decreased insulin, total cholesterol, and low-density lipoprotein cholesterol. When buckwheat intake surpasses 110 g per day, symptoms of insulin resistance occur (8).
In addition to being abundant in nutrients, finger millet includes a variety of bioactive substances such as polyphenols, flavonoids, phytic acid, and dietary fiber. Polyphenols have anti-oxidant and anti-diabetic properties. Phytic acid may inhibit carbohydrate digestibility and control post-prandial glucose levels and obesity (9).
Digestive System
According to the study, various millet bio-actives efficiently regulated pathogenic gut flora, such as Shigella and Clostridium histolyticum, lowering gut inflammation (9).
Buckwheat flavonoids have hepatoprotective properties. They may lower serum aspartate transaminase activity at the molecular level (7).
As buckwheat and millet are gluten-free, people with celiac disease and gluten sensitivities may consume them.
Cancer
Millets include dietary fibers, plant protease inhibitors, and bioactive peptides that might cause apoptosis, stop cell proliferation, and interact with the gut microbiota to potentially have anti-cancer effects (5).
The results show that buckwheat hull has anti-cancer properties against some types of cancer cells. Hexane and ethyl acetate fractions found in buckwheat have inhibitory effects against MCF-7 cells in vitro (10).
Sources
- https://www.beyondceliac.org/gluten-free-diet/
- https://www.beyondceliac.org/gluten-free-diet/is-it-gluten-free/buckwheat/
- https://www.ncbi.nlm.nih.gov/pmc/articles/PMC5986499/
- https://pubmed.ncbi.nlm.nih.gov/29762481/
- https://pubmed.ncbi.nlm.nih.gov/38021676/
- https://pubmed.ncbi.nlm.nih.gov/20534332/
- https://www.ncbi.nlm.nih.gov/pmc/articles/PMC10171551/
- https://pubmed.ncbi.nlm.nih.gov/27919453/
- https://pubmed.ncbi.nlm.nih.gov/36618686/
- https://pubmed.ncbi.nlm.nih.gov/17651057/

Infographic
All nutrients comparison - raw data values
| Nutrient | |
|
DV% diff. |
| Fiber | 1.3g | 2.7g | 6% |
| Manganese | 0.272mg | 0.403mg | 6% |
| Vitamin B1 | 0.106mg | 0.04mg | 6% |
| Phosphorus | 100mg | 70mg | 4% |
| Vitamin B5 | 0.171mg | 0.359mg | 4% |
| Zinc | 0.91mg | 0.61mg | 3% |
| Vitamin B2 | 0.082mg | 0.039mg | 3% |
| Magnesium | 44mg | 51mg | 2% |
| Iron | 0.63mg | 0.8mg | 2% |
| Copper | 0.161mg | 0.146mg | 2% |
| Selenium | 0.9µg | 2.2µg | 2% |
| Vitamin B3 | 1.33mg | 0.94mg | 2% |
| Vitamin B6 | 0.108mg | 0.077mg | 2% |
| Choline | 11.2mg | 20.1mg | 2% |
| Polyunsaturated fat | 0.508g | 0.188g | 2% |
| Calories | 119kcal | 92kcal | 1% |
| Fats | 1g | 0.62g | 1% |
| Carbs | 23.67g | 19.94g | 1% |
| Potassium | 62mg | 88mg | 1% |
| Vitamin K | 0.3µg | 1.9µg | 1% |
| Folate | 19µg | 14µg | 1% |
| Protein | 3.51g | 3.38g | 0% |
| Protein per 100 calories | 2.9g | 3.7g | N/A |
| Calories per 10 g protein | 339kcal | 272kcal | N/A |
| Weight per 100 calories | 84g | 109g | N/A |
| Net carbs | 22.37g | 17.24g | N/A |
| Calcium | 3mg | 7mg | 0% |
| Sugar | 0.13g | 0.9g | N/A |
| Sodium | 2mg | 4mg | 0% |
| Vitamin E | 0.02mg | 0.09mg | 0% |
| Saturated fat | 0.172g | 0.134g | 0% |
| Monounsaturated fat | 0.184g | 0.188g | 0% |
| Tryptophan | 0.038mg | 0.049mg | 0% |
| Threonine | 0.113mg | 0.129mg | 0% |
| Isoleucine | 0.148mg | 0.127mg | 0% |
| Leucine | 0.446mg | 0.212mg | 0% |
| Lysine | 0.067mg | 0.172mg | 0% |
| Methionine | 0.07mg | 0.044mg | 0% |
| Phenylalanine | 0.185mg | 0.133mg | 0% |
| Valine | 0.184mg | 0.173mg | 0% |
| Histidine | 0.075mg | 0.079mg | 0% |
| Fructose | 0.1g | 0% |
People also compare


References
All the values for which the sources are not specified explicitly are taken from FDA’s Food Central. The exact link to the food presented on this page can be found below.
- Millet - https://fdc.nal.usda.gov/fdc-app.html#/food-details/168871/nutrients
- Buckwheat - https://fdc.nal.usda.gov/fdc-app.html#/food-details/170686/nutrients
All the Daily Values are presented for males aged 31-50, for 2000-calorie diets.