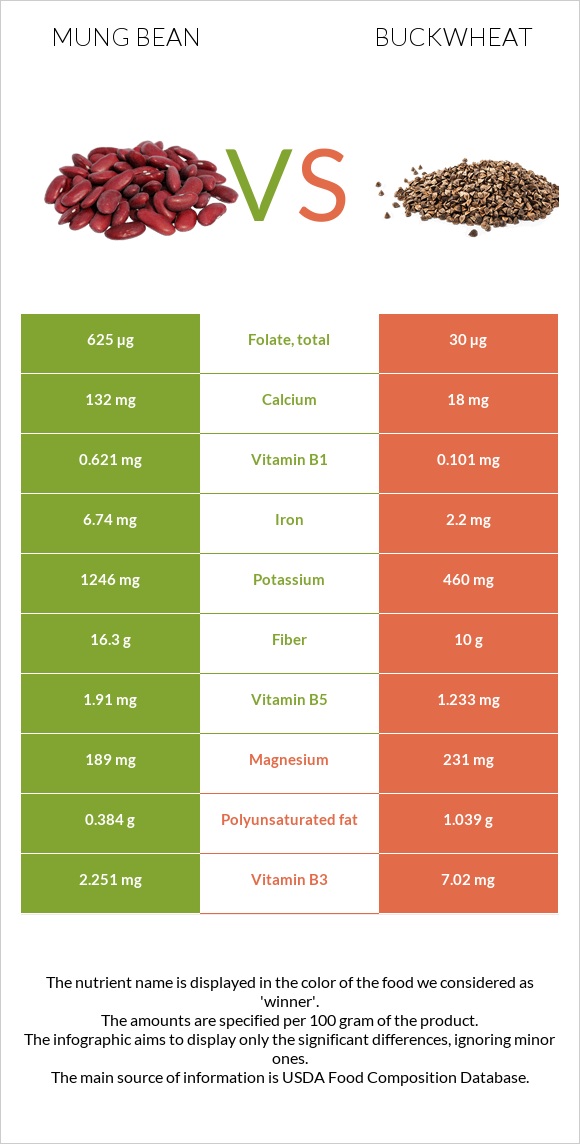
Significant differences between mung beans and buckwheat Mung beans are richer than buckwheat in folate, copper, iron, fiber, vitamin B1, phosphorus, potassium, magnesium, vitamin B5, and manganese. Mung beans cover your daily folate needs 153% more than buckwheat. Mung beans have 16 times more vitamin B1 than buckwheat. Mung beans have 0.621mg of vitamin B1, while buckwheat has 0.04mg. Buckwheat has a higher glycemic index (51) than mung beans (31). Specific food types used in this comparison are Mung beans, mature seeds, raw and Buckwheat groats, roasted, cooked .
Infographic
Mineral Comparison
Mineral comparison score is based on the number of minerals by which one or the other food is richer. The "coverage" charts below show how much of the daily needs can be covered by 300 grams of the food.
9
100 g
300 g
1 tbsp - 13g 1 cup - 207g
Magnesium
Magnesium
Calcium
Calcium
Potassium
Potassium
Iron
Iron
Copper
Copper
Zinc
Zinc
Phosphorus
Phosphorus
Sodium
Sodium
Manganese
Manganese
Selenium
Selenium
135%
40%
110%
253%
314%
73%
157%
2%
135%
45%
1
100 g
300 g
1 cup - 168g
Magnesium
Magnesium
Calcium
Calcium
Potassium
Potassium
Iron
Iron
Copper
Copper
Zinc
Zinc
Phosphorus
Phosphorus
Sodium
Sodium
Manganese
Manganese
Selenium
Selenium
36%
2.1%
7.8%
30%
49%
17%
30%
0.52%
53%
12%
Vitamin Comparison
Vitamin comparison score is based on the number of vitamins by which one or the other food is richer. The "coverage" charts below show how much of the daily needs can be covered by 300 grams of the food.
10
100 g
300 g
1 tbsp - 13g 1 cup - 207g
Vitamin C
Vit. C
Vitamin D
Vit. D
Vitamin A
Vit. A
Vitamin E
Vit. E
Vitamin B1
Vit. B1
Vitamin B2
Vit. B2
Vitamin B3
Vit. B3
Vitamin B5
Vit. B5
Vitamin B6
Vit. B6
Vitamin B12
Vit. B12
Vitamin K
Vit. K
Folate
Folate
16%
0%
2%
10%
155%
54%
42%
115%
88%
0%
23%
469%
0
100 g
300 g
1 cup - 168g
Vitamin C
Vit. C
Vitamin D
Vit. D
Vitamin A
Vit. A
Vitamin E
Vit. E
Vitamin B1
Vit. B1
Vitamin B2
Vit. B2
Vitamin B3
Vit. B3
Vitamin B5
Vit. B5
Vitamin B6
Vit. B6
Vitamin B12
Vit. B12
Vitamin K
Vit. K
Folate
Folate
0%
0%
0%
1.8%
10%
9%
18%
22%
18%
0%
4.8%
11%
All nutrients comparison - raw data values
Nutrient
DV% diff.
Folate
625µg
14µg
153%
Copper
0.941mg
0.146mg
88%
Iron
6.74mg
0.8mg
74%
Fiber
16.3g
2.7g
54%
Vitamin B1
0.621mg
0.04mg
48%
Phosphorus
367mg
70mg
42%
Protein
23.86g
3.38g
41%
Potassium
1246mg
88mg
34%
Magnesium
189mg
51mg
33%
Vitamin B5
1.91mg
0.359mg
31%
Manganese
1.035mg
0.403mg
27%
Vitamin B6
0.382mg
0.077mg
23%
Zinc
2.68mg
0.61mg
19%
Vitamin B2
0.233mg
0.039mg
15%
Carbs
62.62g
19.94g
14%
Choline
97.9mg
20.1mg
14%
Calories
347kcal
92kcal
13%
Calcium
132mg
7mg
13%
Selenium
8.2µg
2.2µg
11%
Vitamin B3
2.251mg
0.94mg
8%
Vitamin K
9µg
1.9µg
6%
Vitamin C
4.8mg
0mg
5%
Vitamin E
0.51mg
0.09mg
3%
Fats
1.15g
0.62g
1%
Vitamin A
6µg
0µg
1%
Saturated fat
0.348g
0.134g
1%
Polyunsaturated fat
0.384g
0.188g
1%
Protein per 100 calories
6.9g
3.7g
N/A
Calories per 10 g protein
145kcal
272kcal
N/A
Weight per 100 calories
29g
109g
N/A
Net carbs
46.32g
17.24g
N/A
Sugar
6.6g
0.9g
N/A
Sodium
15mg
4mg
0%
Monounsaturated fat
0.161g
0.188g
0%
Tryptophan
0.26mg
0.049mg
0%
Threonine
0.782mg
0.129mg
0%
Isoleucine
1.008mg
0.127mg
0%
Leucine
1.847mg
0.212mg
0%
Lysine
1.664mg
0.172mg
0%
Methionine
0.286mg
0.044mg
0%
Phenylalanine
1.443mg
0.133mg
0%
Valine
1.237mg
0.173mg
0%
Histidine
0.695mg
0.079mg
0%
Fructose
0.1g
0%
Macronutrient Comparison
Macronutrient breakdown side-by-side comparison
4
24%
63%
9%
3%
Protein:
23.86 g
Fats:
1.15 g
Carbs:
62.62 g
Water:
9.05 g
Other:
3.32 g
1
3%
20%
76%
Protein:
3.38 g
Fats:
0.62 g
Carbs:
19.94 g
Water:
75.63 g
Other:
0.43 g
Contains
more
Protein Protein
+605.9%
Contains
more
Fats Fats
+85.5%
Contains
more
Carbs Carbs
+214%
Contains
more
Other Other
+672.1%
Contains
more
Water Water
+735.7%
Fat Type Comparison
Fat type breakdown side-by-side comparison
1
39%
18%
43%
Saturated fat:
Sat. Fat
0.348 g
Monounsaturated fat:
Mono. Fat
0.161 g
Polyunsaturated fat:
Poly. Fat
0.384 g
2
26%
37%
37%
Saturated fat:
Sat. Fat
0.134 g
Monounsaturated fat:
Mono. Fat
0.188 g
Polyunsaturated fat:
Poly. Fat
0.188 g
Contains
more
Poly. Fat Polyunsaturated fat
+104.3%
Contains
less
Sat. Fat Saturated fat
-61.5%
Contains
more
Mono. Fat Monounsaturated fat
+16.8%