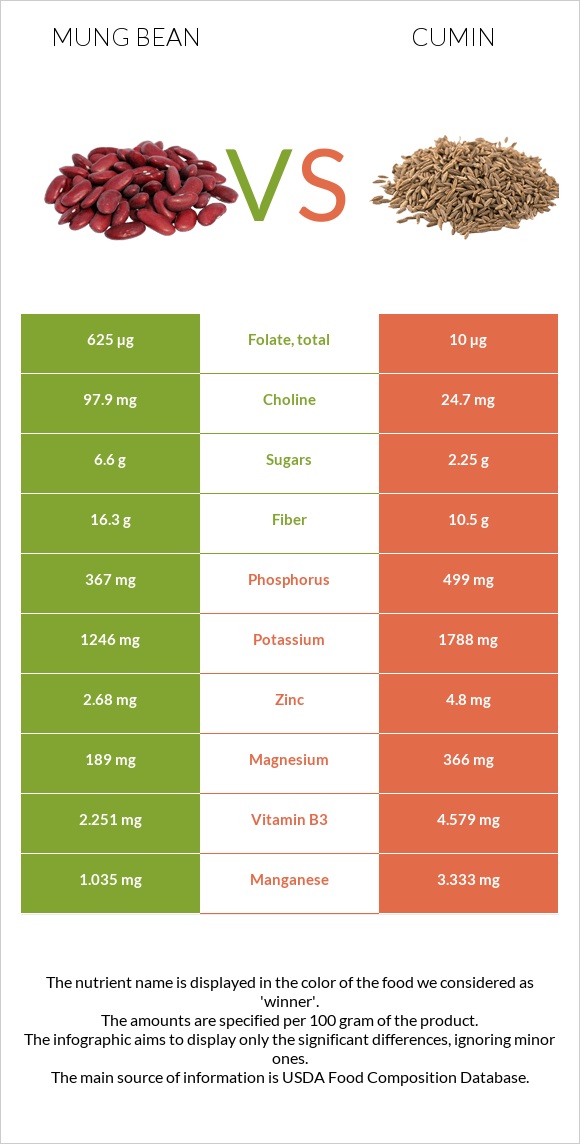
The main differences between mung beans and cumin Mung beans have more folate and fiber; however, cumin has more iron, manganese, calcium, magnesium, vitamin A, zinc, phosphorus, and vitamin E. Daily need coverage for iron for cumin is 745% higher. Cumin has 63 times less folate than mung beans. Mung beans have 625µg of folate, while cumin has 10µg. Mung beans have a higher glycemic index than cumin. Food types used in this article are Mung beans, mature seeds, raw and Spices, cumin seed .
Infographic
Mineral Comparison
Mineral comparison score is based on the number of minerals by which one or the other food is richer. The "coverage" charts below show how much of the daily needs can be covered by 300 grams of the food.
2
100 g
300 g
1 tbsp - 13g 1 cup - 207g
Magnesium
Magnesium
Calcium
Calcium
Potassium
Potassium
Iron
Iron
Copper
Copper
Zinc
Zinc
Phosphorus
Phosphorus
Sodium
Sodium
Manganese
Manganese
Selenium
Selenium
135%
40%
110%
253%
314%
73%
157%
2%
135%
45%
7
100 g
300 g
0.25 tsp, whole - 0.5g 1 tbsp, whole - 6g
Magnesium
Magnesium
Calcium
Calcium
Potassium
Potassium
Iron
Iron
Copper
Copper
Zinc
Zinc
Phosphorus
Phosphorus
Sodium
Sodium
Manganese
Manganese
Selenium
Selenium
261%
279%
158%
2489%
289%
131%
214%
22%
435%
28%
Vitamin Comparison
Vitamin comparison score is based on the number of vitamins by which one or the other food is richer. The "coverage" charts below show how much of the daily needs can be covered by 300 grams of the food.
3
100 g
300 g
1 tbsp - 13g 1 cup - 207g
Vitamin C
Vit. C
Vitamin D
Vit. D
Vitamin A
Vit. A
Vitamin E
Vit. E
Vitamin B1
Vit. B1
Vitamin B2
Vit. B2
Vitamin B3
Vit. B3
Vitamin B5
Vit. B5
Vitamin B6
Vit. B6
Vitamin B12
Vit. B12
Vitamin K
Vit. K
Folate
Folate
16%
0%
2%
10%
155%
54%
42%
115%
88%
0%
23%
469%
6
100 g
300 g
0.25 tsp, whole - 0.5g 1 tbsp, whole - 6g
Vitamin C
Vit. C
Vitamin D
Vit. D
Vitamin A
Vit. A
Vitamin E
Vit. E
Vitamin B1
Vit. B1
Vitamin B2
Vit. B2
Vitamin B3
Vit. B3
Vitamin B5
Vit. B5
Vitamin B6
Vit. B6
Vitamin B12
Vit. B12
Vitamin K
Vit. K
Folate
Folate
26%
0%
21%
67%
157%
75%
86%
0%
100%
0%
14%
7.5%
All nutrients comparison - raw data values
Nutrient
DV% diff.
Iron
6.74mg
66.36mg
745%
Folate
625µg
10µg
154%
Manganese
1.035mg
3.333mg
100%
Calcium
132mg
931mg
80%
Magnesium
189mg
366mg
42%
Vitamin B5
1.91mg
38%
Monounsaturated fat
0.161g
14.04g
35%
Fats
1.15g
22.27g
32%
Fiber
16.3g
10.5g
23%
Zinc
2.68mg
4.8mg
19%
Phosphorus
367mg
499mg
19%
Vitamin E
0.51mg
3.33mg
19%
Polyunsaturated fat
0.384g
3.279g
19%
Potassium
1246mg
1788mg
16%
Vitamin B3
2.251mg
4.579mg
15%
Choline
97.9mg
24.7mg
13%
Protein
23.86g
17.81g
12%
Copper
0.941mg
0.867mg
8%
Sodium
15mg
168mg
7%
Vitamin B2
0.233mg
0.327mg
7%
Carbs
62.62g
44.24g
6%
Vitamin A
6µg
64µg
6%
Selenium
8.2µg
5.2µg
5%
Saturated fat
0.348g
1.535g
5%
Vitamin B6
0.382mg
0.435mg
4%
Vitamin C
4.8mg
7.7mg
3%
Vitamin K
9µg
5.4µg
3%
Calories
347kcal
375kcal
1%
Vitamin B1
0.621mg
0.628mg
1%
Protein per 100 calories
6.9g
4.7g
N/A
Calories per 10 g protein
145kcal
211kcal
N/A
Weight per 100 calories
29g
27g
N/A
Unsaturated / Saturated Fat ratio
1.6
11
N/A
Net carbs
46.32g
33.74g
N/A
Sugar
6.6g
2.25g
N/A
Tryptophan
0.26mg
0%
Threonine
0.782mg
0%
Isoleucine
1.008mg
0%
Leucine
1.847mg
0%
Lysine
1.664mg
0%
Methionine
0.286mg
0%
Phenylalanine
1.443mg
0%
Valine
1.237mg
0%
Histidine
0.695mg
0%
Macronutrient Comparison
Macronutrient breakdown side-by-side comparison
3
24%
63%
9%
3%
Protein:
23.86 g
Fats:
1.15 g
Carbs:
62.62 g
Water:
9.05 g
Other:
3.32 g
2
18%
22%
44%
8%
8%
Protein:
17.81 g
Fats:
22.27 g
Carbs:
44.24 g
Water:
8.06 g
Other:
7.62 g
Contains
more
Protein Protein
+34%
Contains
more
Carbs Carbs
+41.5%
Contains
more
Water Water
+12.3%
Contains
more
Fats Fats
+1836.5%
Contains
more
Other Other
+129.5%
Fat Type Comparison
Fat type breakdown side-by-side comparison
1
39%
18%
43%
Saturated fat:
Sat. Fat
0.348 g
Monounsaturated fat:
Mono. Fat
0.161 g
Polyunsaturated fat:
Poly. Fat
0.384 g
2
8%
74%
17%
Saturated fat:
Sat. Fat
1.535 g
Monounsaturated fat:
Mono. Fat
14.04 g
Polyunsaturated fat:
Poly. Fat
3.279 g
Contains
less
Sat. Fat Saturated fat
-77.3%
Contains
more
Mono. Fat Monounsaturated fat
+8620.5%
Contains
more
Poly. Fat Polyunsaturated fat
+753.9%