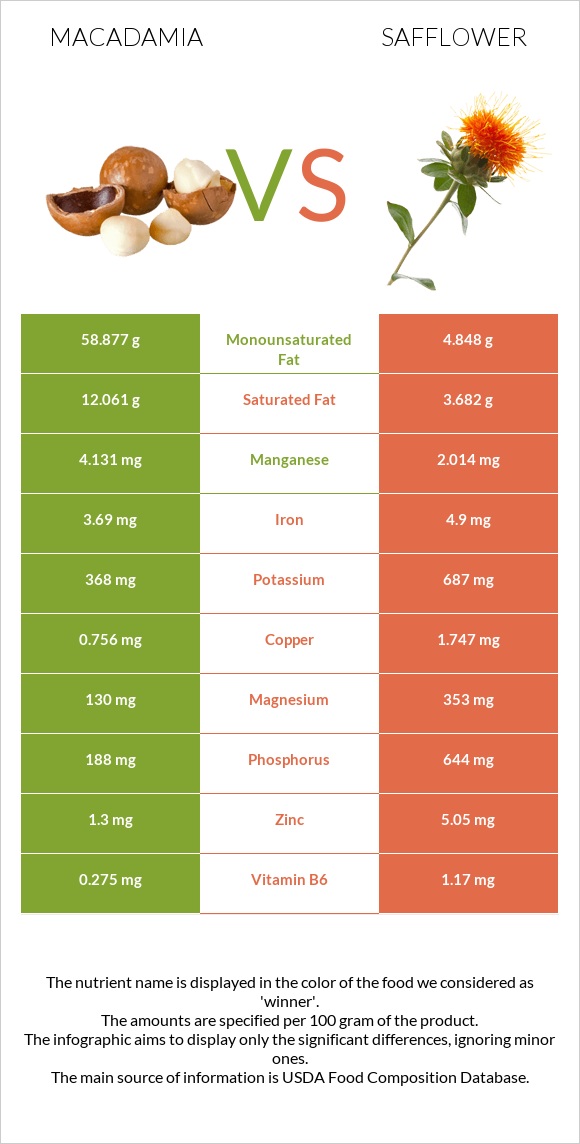
Important differences between macadamia and safflower Macadamia has more manganese; however, safflower is richer in copper, vitamin B6, vitamin B5, phosphorus, magnesium, folate, zinc, and vitamin B2. Safflower's daily need coverage for copper is 110% more. Macadamia contains 3 times more saturated fat than safflower. Macadamia contains 12.061g of saturated fat, while safflower contains 3.682g. The food varieties used in the comparison are Nuts, macadamia nuts, raw and Seeds, safflower seed kernels, dried .
Infographic
Mineral Comparison
Mineral comparison score is based on the number of minerals by which one or the other food is richer. The "coverage" charts below show how much of the daily needs can be covered by 300 grams of the food.
2
100 g
300 g
1 oz (10-12 kernels) - 28.35g 1 cup, whole or halves - 134g
Magnesium
Magnesium
Calcium
Calcium
Potassium
Potassium
Iron
Iron
Copper
Copper
Zinc
Zinc
Phosphorus
Phosphorus
Sodium
Sodium
Manganese
Manganese
Selenium
Selenium
93%
26%
32%
138%
252%
35%
81%
0.65%
539%
20%
7
100 g
300 g
1 oz - 28.35g
Magnesium
Magnesium
Calcium
Calcium
Potassium
Potassium
Iron
Iron
Copper
Copper
Zinc
Zinc
Phosphorus
Phosphorus
Sodium
Sodium
Manganese
Manganese
Selenium
Selenium
252%
23%
61%
184%
582%
138%
276%
0.39%
263%
0%
Vitamin Comparison
Vitamin comparison score is based on the number of vitamins by which one or the other food is richer. The "coverage" charts below show how much of the daily needs can be covered by 300 grams of the food.
2
100 g
300 g
1 oz (10-12 kernels) - 28.35g 1 cup, whole or halves - 134g
Vitamin C
Vit. C
Vitamin D
Vit. D
Vitamin A
Vit. A
Vitamin E
Vit. E
Vitamin B1
Vit. B1
Vitamin B2
Vit. B2
Vitamin B3
Vit. B3
Vitamin B5
Vit. B5
Vitamin B6
Vit. B6
Vitamin B12
Vit. B12
Vitamin K
Vit. K
Folate
Folate
4%
0%
0%
11%
299%
37%
46%
45%
63%
0%
0%
8.3%
5
100 g
300 g
1 oz - 28.35g
Vitamin C
Vit. C
Vitamin D
Vit. D
Vitamin A
Vit. A
Vitamin E
Vit. E
Vitamin B1
Vit. B1
Vitamin B2
Vit. B2
Vitamin B3
Vit. B3
Vitamin B5
Vit. B5
Vitamin B6
Vit. B6
Vitamin B12
Vit. B12
Vitamin K
Vit. K
Folate
Folate
0%
0%
1%
0%
291%
96%
43%
242%
270%
0%
0%
120%
All nutrients comparison - raw data values
Nutrient
DV% diff.
Polyunsaturated fat
1.502g
28.223g
178%
Monounsaturated fat
58.877g
4.848g
135%
Copper
0.756mg
1.747mg
110%
Manganese
4.131mg
2.014mg
92%
Vitamin B6
0.275mg
1.17mg
69%
Phosphorus
188mg
644mg
65%
Vitamin B5
0.758mg
4.03mg
65%
Fats
75.77g
38.45g
57%
Magnesium
130mg
353mg
53%
Saturated fat
12.061g
3.682g
38%
Folate
11µg
160µg
37%
Fiber
8.6g
34%
Zinc
1.3mg
5.05mg
34%
Vitamin B2
0.162mg
0.415mg
19%
Protein
7.91g
16.18g
17%
Iron
3.69mg
4.9mg
15%
Calories
718kcal
517kcal
10%
Potassium
368mg
687mg
9%
Carbs
13.82g
34.29g
7%
Selenium
3.6µg
7%
Vitamin E
0.54mg
4%
Vitamin B1
1.195mg
1.163mg
3%
Vitamin C
1.2mg
0mg
1%
Calcium
85mg
78mg
1%
Vitamin B3
2.473mg
2.284mg
1%
Protein per 100 calories
1.1g
3.1g
N/A
Calories per 10 g protein
908kcal
320kcal
N/A
Weight per 100 calories
14g
19g
N/A
Unsaturated / Saturated Fat ratio
5
9
N/A
Net carbs
5.22g
34.29g
N/A
Sugar
4.57g
N/A
Starch
1.05g
0%
Sodium
5mg
3mg
0%
Vitamin A
0µg
3µg
0%
Tryptophan
0.067mg
0.183mg
0%
Threonine
0.37mg
0.586mg
0%
Isoleucine
0.314mg
0.717mg
0%
Leucine
0.602mg
1.154mg
0%
Lysine
0.018mg
0.534mg
0%
Methionine
0.023mg
0.284mg
0%
Phenylalanine
0.665mg
0.806mg
0%
Valine
0.363mg
1.025mg
0%
Histidine
0.195mg
0.452mg
0%
Fructose
0.07g
0%
Macronutrient Comparison
Macronutrient breakdown side-by-side comparison
1
8%
76%
14%
Protein:
7.91 g
Fats:
75.77 g
Carbs:
13.82 g
Water:
1.36 g
Other:
1.14 g
4
16%
38%
34%
6%
5%
Protein:
16.18 g
Fats:
38.45 g
Carbs:
34.29 g
Water:
5.62 g
Other:
5.46 g
Contains
more
Fats Fats
+97.1%
Contains
more
Protein Protein
+104.6%
Contains
more
Carbs Carbs
+148.1%
Contains
more
Water Water
+313.2%
Contains
more
Other Other
+378.9%
Fat Type Comparison
Fat type breakdown side-by-side comparison
1
17%
81%
2%
Saturated fat:
Sat. Fat
12.061 g
Monounsaturated fat:
Mono. Fat
58.877 g
Polyunsaturated fat:
Poly. Fat
1.502 g
2
10%
13%
77%
Saturated fat:
Sat. Fat
3.682 g
Monounsaturated fat:
Mono. Fat
4.848 g
Polyunsaturated fat:
Poly. Fat
28.223 g
Contains
more
Mono. Fat Monounsaturated fat
+1114.5%
Contains
less
Sat. Fat Saturated fat
-69.5%
Contains
more
Poly. Fat Polyunsaturated fat
+1779%