Nuts, mixed nuts, dry roasted, with peanuts, salt added, CHOSEN ROASTER vs. Hazelnut — In-Depth Nutrition Comparison
Compare
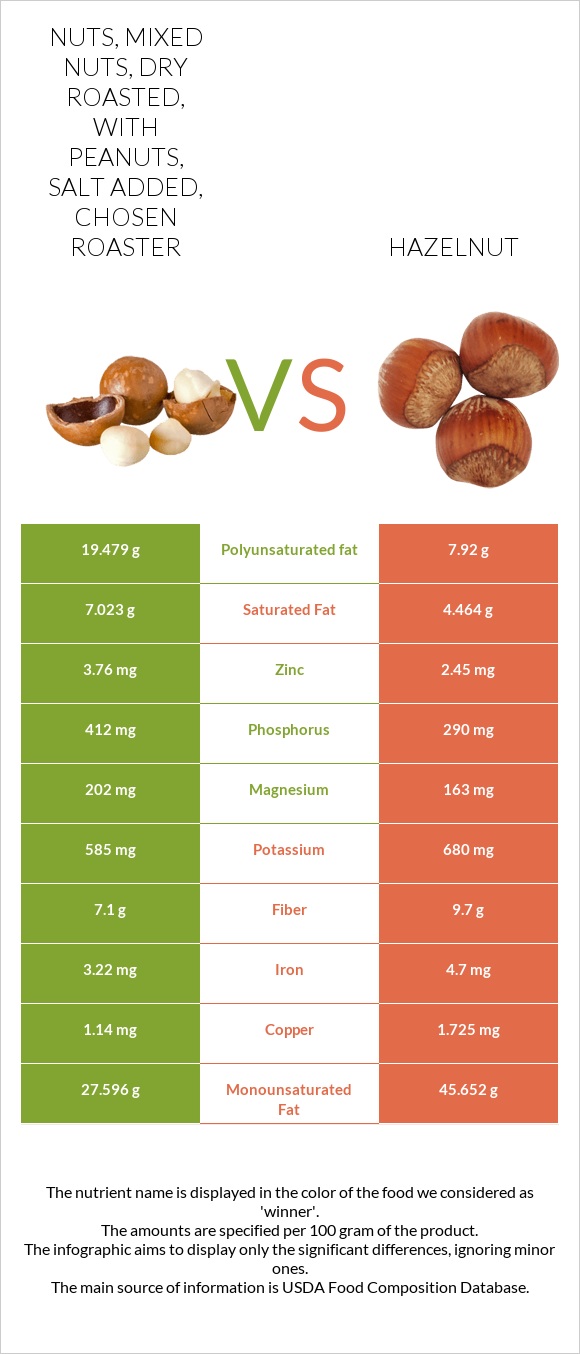
Differences between nuts, mixed nuts, dry roasted, with peanuts, salt added, CHOSEN ROASTER and hazelnut
- Nuts, mixed nuts, dry roasted, with peanuts, salt added, CHOSEN ROASTER is higher in phosphorus, zinc, and magnesium; however, hazelnut is richer in manganese, copper, iron, fiber, and vitamin B5.
- Hazelnut's daily need coverage for manganese is 155% higher.
The food types used in this comparison are Nuts, mixed nuts, dry roasted, with peanuts, salt added, CHOSEN ROASTER and Nuts, hazelnuts or filberts.
Infographic
Infographic link
Mineral Comparison
Mineral comparison score is based on the number of minerals by which one or the other food is richer. The "coverage" charts below show how much of the daily needs can be covered by 300 grams of the food.
| Contains more MagnesiumMagnesium | +23.9% |
| Contains more ZincZinc | +53.5% |
| Contains more PhosphorusPhosphorus | +42.1% |
| Contains more SeleniumSelenium | +54.2% |
| Contains more PotassiumPotassium | +16.2% |
| Contains more IronIron | +46% |
| Contains more CopperCopper | +51.3% |
| Contains less SodiumSodium | -100% |
| Contains more ManganeseManganese | +136.6% |
Vitamin Comparison
Vitamin comparison score is based on the number of vitamins by which one or the other food is richer. The "coverage" charts below show how much of the daily needs can be covered by 300 grams of the food.
| Contains more Vitamin B5Vitamin B5 | +70% |
All nutrients comparison - raw data values
| Nutrient |  |
 |
DV% diff. |
| Manganese | 2.61mg | 6.175mg | 155% |
| Vitamin E | 15.03mg | 100% | |
| Polyunsaturated fat | 19.479g | 7.92g | 77% |
| Copper | 1.14mg | 1.725mg | 65% |
| Vitamin B1 | 0.643mg | 54% | |
| Monounsaturated fat | 27.596g | 45.652g | 45% |
| Vitamin B6 | 0.563mg | 43% | |
| Folate | 113µg | 28% | |
| Iron | 3.22mg | 4.7mg | 19% |
| Phosphorus | 412mg | 290mg | 17% |
| Zinc | 3.76mg | 2.45mg | 12% |
| Vitamin K | 14.2µg | 12% | |
| Saturated fat | 7.023g | 4.464g | 12% |
| Vitamin B3 | 1.8mg | 11% | |
| Fiber | 7.1g | 9.7g | 10% |
| Magnesium | 202mg | 163mg | 9% |
| Vitamin B2 | 0.113mg | 9% | |
| Vitamin B5 | 0.54mg | 0.918mg | 8% |
| Choline | 45.6mg | 8% | |
| Vitamin C | 6.3mg | 7% | |
| Protein | 18g | 14.95g | 6% |
| Sodium | 113mg | 0mg | 5% |
| Fats | 58.8g | 60.75g | 3% |
| Potassium | 585mg | 680mg | 3% |
| Selenium | 3.7µg | 2.4µg | 2% |
| Carbs | 19.02g | 16.7g | 1% |
| Calcium | 106mg | 114mg | 1% |
| Calories | 632kcal | 628kcal | 0% |
| Protein per 100 calories | 2.8g | 2.4g | N/A |
| Calories per 10 g protein | 351kcal | 420kcal | N/A |
| Weight per 100 calories | 16g | 16g | N/A |
| Unsaturated / Saturated Fat ratio | 6.7 | 12 | N/A |
| Net carbs | 11.92g | 7g | N/A |
| Sugar | 3.9g | 4.34g | N/A |
| Starch | 0.48g | 0% | |
| Vitamin A | 1µg | 0% | |
| Trans fat | 0.033g | N/A | |
| Tryptophan | 0.193mg | 0% | |
| Threonine | 0.497mg | 0% | |
| Isoleucine | 0.545mg | 0% | |
| Leucine | 1.063mg | 0% | |
| Lysine | 0.42mg | 0% | |
| Methionine | 0.221mg | 0% | |
| Phenylalanine | 0.663mg | 0% | |
| Valine | 0.701mg | 0% | |
| Histidine | 0.432mg | 0% | |
| Fructose | 0g | 0.07g | 0% |
| Omega-3 - EPA | 0.008g | 0g | N/A |
| Omega-3 - ALA | 2.017g | N/A | |
| Omega-6 - Gamma-linoleic acid | 0.008g | N/A | |
| Omega-6 - Eicosadienoic acid | 0.006g | 0g | N/A |
| Omega-6 - Linoleic acid | 17.412g | N/A |
Macronutrient Comparison
Macronutrient breakdown side-by-side comparison
Protein:
18 g
Fats:
58.8 g
Carbs:
19.02 g
Water:
1.52 g
Other:
2.66 g
Protein:
14.95 g
Fats:
60.75 g
Carbs:
16.7 g
Water:
5.31 g
Other:
2.29 g
| Contains more ProteinProtein | +20.4% |
| Contains more CarbsCarbs | +13.9% |
| Contains more OtherOther | +16.2% |
| Contains more WaterWater | +249.3% |
~equal in
Fats
~60.75g
Fat Type Comparison
Fat type breakdown side-by-side comparison
Saturated fat:
Sat. Fat
7.023 g
Monounsaturated fat:
Mono. Fat
27.596 g
Polyunsaturated fat:
Poly. Fat
19.479 g
Saturated fat:
Sat. Fat
4.464 g
Monounsaturated fat:
Mono. Fat
45.652 g
Polyunsaturated fat:
Poly. Fat
7.92 g
| Contains more Poly. FatPolyunsaturated fat | +145.9% |
| Contains less Sat. FatSaturated fat | -36.4% |
| Contains more Mono. FatMonounsaturated fat | +65.4% |
Carbohydrate type comparison
Carbohydrate type breakdown side-by-side comparison
Starch:
0 g
Sucrose:
3.9 g
Glucose:
0 g
Fructose:
0 g
Lactose:
0 g
Maltose:
0 g
Galactose:
0 g
Starch:
0.48 g
Sucrose:
4.2 g
Glucose:
0.07 g
Fructose:
0.07 g
Lactose:
0 g
Maltose:
0 g
Galactose:
0 g
| Contains more StarchStarch | +∞% |
| Contains more GlucoseGlucose | +∞% |
| Contains more FructoseFructose | +∞% |
~equal in
Sucrose
~4.2g
~equal in
Lactose
~0g
~equal in
Maltose
~0g
~equal in
Galactose
~0g