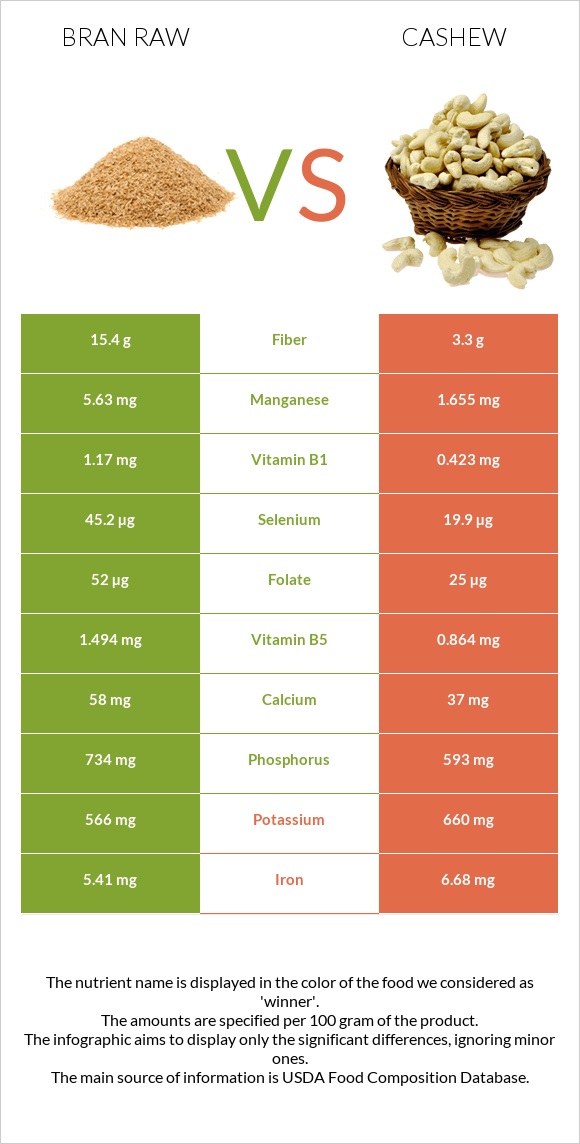
Significant differences between bran raw and cashew Bran raw has more manganese, vitamin B1, fiber, selenium, and phosphorus; however, cashew is richer in copper, vitamin K, zinc, and vitamin B6. Cashew covers your daily copper needs 199% more than bran raw. Cashew has 5 times less fiber than bran raw. Bran raw has 15.4g of fiber, while cashew has 3.3g. Bran raw contains less saturated fat. Bran raw has a higher glycemic index. The glycemic index of bran raw is 56, while the glycemic index of cashew is 25. Specific food types used in this comparison are Oat bran, raw and Nuts, cashew nuts, raw .
Infographic
Mineral Comparison
Mineral comparison score is based on the number of minerals by which one or the other food is richer. The "coverage" charts below show how much of the daily needs can be covered by 300 grams of the food.
5
100 g
300 g
1 cup - 94g
Magnesium
Magnesium
Calcium
Calcium
Potassium
Potassium
Iron
Iron
Copper
Copper
Zinc
Zinc
Phosphorus
Phosphorus
Sodium
Sodium
Manganese
Manganese
Selenium
Selenium
168%
17%
50%
203%
134%
85%
315%
0.52%
734%
247%
5
100 g
300 g
1 oz - 28.35g
Magnesium
Magnesium
Calcium
Calcium
Potassium
Potassium
Iron
Iron
Copper
Copper
Zinc
Zinc
Phosphorus
Phosphorus
Sodium
Sodium
Manganese
Manganese
Selenium
Selenium
209%
11%
58%
251%
732%
158%
254%
1.6%
216%
109%
Vitamin Comparison
Vitamin comparison score is based on the number of vitamins by which one or the other food is richer. The "coverage" charts below show how much of the daily needs can be covered by 300 grams of the food.
5
100 g
300 g
1 cup - 94g
Vitamin C
Vit. C
Vitamin D
Vit. D
Vitamin A
Vit. A
Vitamin E
Vit. E
Vitamin B1
Vit. B1
Vitamin B2
Vit. B2
Vitamin B3
Vit. B3
Vitamin B5
Vit. B5
Vitamin B6
Vit. B6
Vitamin B12
Vit. B12
Vitamin K
Vit. K
Folate
Folate
0%
0%
0%
20%
293%
51%
18%
90%
38%
0%
8%
39%
4
100 g
300 g
1 oz - 28.35g
Vitamin C
Vit. C
Vitamin D
Vit. D
Vitamin A
Vit. A
Vitamin E
Vit. E
Vitamin B1
Vit. B1
Vitamin B2
Vit. B2
Vitamin B3
Vit. B3
Vitamin B5
Vit. B5
Vitamin B6
Vit. B6
Vitamin B12
Vit. B12
Vitamin K
Vit. K
Folate
Folate
1.7%
0%
0%
18%
106%
13%
20%
52%
96%
0%
85%
19%
All nutrients comparison - raw data values
Nutrient
DV% diff.
Copper
0.403mg
2.195mg
199%
Manganese
5.63mg
1.655mg
173%
Vitamin B1
1.17mg
0.423mg
62%
Fats
7.03g
43.85g
57%
Monounsaturated fat
2.376g
23.797g
54%
Fiber
15.4g
3.3g
48%
Selenium
45.2µg
19.9µg
46%
Polyunsaturated fat
2.766g
7.845g
34%
Saturated fat
1.328g
7.783g
29%
Vitamin K
3.2µg
34.1µg
26%
Zinc
3.11mg
5.78mg
24%
Phosphorus
734mg
593mg
20%
Vitamin B6
0.165mg
0.417mg
19%
Iron
5.41mg
6.68mg
16%
Calories
246kcal
553kcal
15%
Magnesium
235mg
292mg
14%
Vitamin B5
1.494mg
0.864mg
13%
Carbs
66.22g
30.19g
12%
Vitamin B2
0.22mg
0.058mg
12%
Starch
23.49g
10%
Folate
52µg
25µg
7%
Choline
32.2mg
6%
Potassium
566mg
660mg
3%
Protein
17.3g
18.22g
2%
Calcium
58mg
37mg
2%
Vitamin C
0mg
0.5mg
1%
Vitamin E
1.01mg
0.9mg
1%
Vitamin B3
0.934mg
1.062mg
1%
Protein per 100 calories
7g
3.3g
N/A
Calories per 10 g protein
142kcal
304kcal
N/A
Weight per 100 calories
41g
18g
N/A
Unsaturated / Saturated Fat ratio
3.9
4.1
N/A
Net carbs
50.82g
26.89g
N/A
Sugar
1.45g
5.91g
N/A
Sodium
4mg
12mg
0%
Tryptophan
0.335mg
0.287mg
0%
Threonine
0.502mg
0.688mg
0%
Isoleucine
0.668mg
0.789mg
0%
Leucine
1.374mg
1.472mg
0%
Lysine
0.76mg
0.928mg
0%
Methionine
0.335mg
0.362mg
0%
Phenylalanine
0.908mg
0.951mg
0%
Valine
0.964mg
1.094mg
0%
Histidine
0.41mg
0.456mg
0%
Fructose
0.05g
0%
Macronutrient Comparison
Macronutrient breakdown side-by-side comparison
3
17%
7%
66%
7%
3%
Protein:
17.3 g
Fats:
7.03 g
Carbs:
66.22 g
Water:
6.55 g
Other:
2.9 g
2
18%
44%
30%
5%
3%
Protein:
18.22 g
Fats:
43.85 g
Carbs:
30.19 g
Water:
5.2 g
Other:
2.54 g
Contains
more
Carbs Carbs
+119.3%
Contains
more
Water Water
+26%
Contains
more
Other Other
+14.2%
Contains
more
Fats Fats
+523.8%
~equal in
Protein
~18.22g
Fat Type Comparison
Fat type breakdown side-by-side comparison
1
21%
37%
43%
Saturated fat:
Sat. Fat
1.328 g
Monounsaturated fat:
Mono. Fat
2.376 g
Polyunsaturated fat:
Poly. Fat
2.766 g
2
20%
60%
20%
Saturated fat:
Sat. Fat
7.783 g
Monounsaturated fat:
Mono. Fat
23.797 g
Polyunsaturated fat:
Poly. Fat
7.845 g
Contains
less
Sat. Fat Saturated fat
-82.9%
Contains
more
Mono. Fat Monounsaturated fat
+901.6%
Contains
more
Poly. Fat Polyunsaturated fat
+183.6%