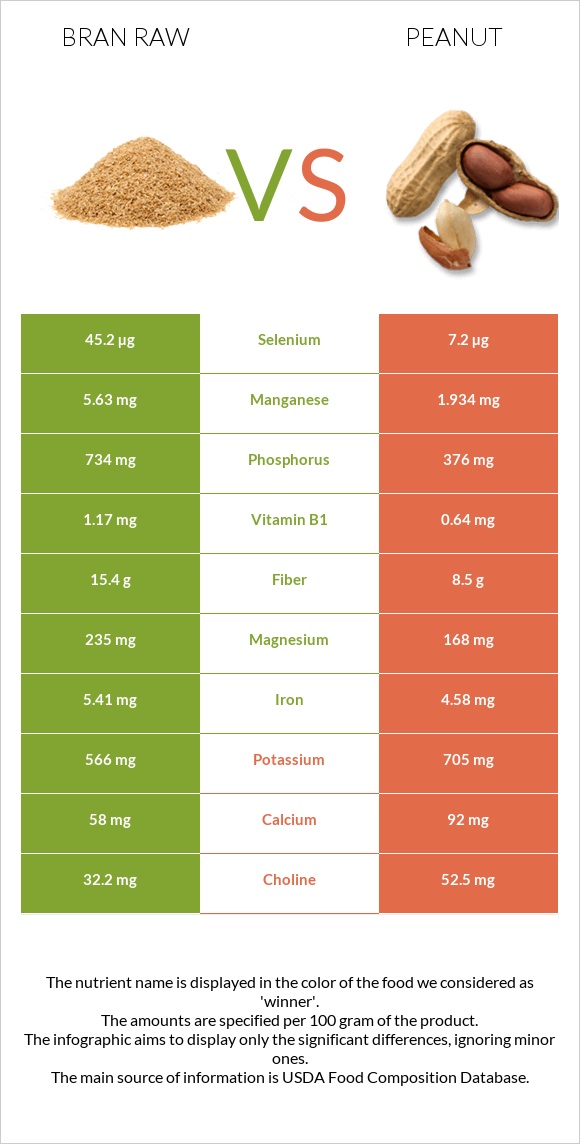
Significant differences between bran raw and peanuts Bran raw has more manganese, selenium, phosphorus, vitamin B1, and fiber; however, peanuts are richer in copper, vitamin B3, vitamin E, and folate. Bran raw covers your daily manganese needs 161% more than peanuts. Peanuts have 6 times less selenium than bran raw. Bran raw has 45.2µg of selenium, while peanuts have 7.2µg. Bran raw contains less saturated fat. Bran raw has a higher glycemic index. The glycemic index of bran raw is 56, while the glycemic index of peanuts is 13. Specific food types used in this comparison are Oat bran, raw and Peanuts, all types, raw .
Infographic
Mineral Comparison
Mineral comparison score is based on the number of minerals by which one or the other food is richer. The "coverage" charts below show how much of the daily needs can be covered by 300 grams of the food.
6
100 g
300 g
1 cup - 94g
Magnesium
Magnesium
Calcium
Calcium
Potassium
Potassium
Iron
Iron
Copper
Copper
Zinc
Zinc
Phosphorus
Phosphorus
Sodium
Sodium
Manganese
Manganese
Selenium
Selenium
168%
17%
50%
203%
134%
85%
315%
0.52%
734%
247%
3
100 g
300 g
1 oz - 28.35g 1 cup - 146g
Magnesium
Magnesium
Calcium
Calcium
Potassium
Potassium
Iron
Iron
Copper
Copper
Zinc
Zinc
Phosphorus
Phosphorus
Sodium
Sodium
Manganese
Manganese
Selenium
Selenium
120%
28%
62%
172%
381%
89%
161%
2.3%
252%
39%
Vitamin Comparison
Vitamin comparison score is based on the number of vitamins by which one or the other food is richer. The "coverage" charts below show how much of the daily needs can be covered by 300 grams of the food.
3
100 g
300 g
1 cup - 94g
Vitamin C
Vit. C
Vitamin D
Vit. D
Vitamin A
Vit. A
Vitamin E
Vit. E
Vitamin B1
Vit. B1
Vitamin B2
Vit. B2
Vitamin B3
Vit. B3
Vitamin B5
Vit. B5
Vitamin B6
Vit. B6
Vitamin B12
Vit. B12
Vitamin K
Vit. K
Folate
Folate
0%
0%
0%
20%
293%
51%
18%
90%
38%
0%
8%
39%
5
100 g
300 g
1 oz - 28.35g 1 cup - 146g
Vitamin C
Vit. C
Vitamin D
Vit. D
Vitamin A
Vit. A
Vitamin E
Vit. E
Vitamin B1
Vit. B1
Vitamin B2
Vit. B2
Vitamin B3
Vit. B3
Vitamin B5
Vit. B5
Vitamin B6
Vit. B6
Vitamin B12
Vit. B12
Vitamin K
Vit. K
Folate
Folate
0%
0%
0%
167%
160%
31%
226%
106%
80%
0%
0%
180%
All nutrients comparison - raw data values
Nutrient
DV% diff.
Manganese
5.63mg
1.934mg
161%
Polyunsaturated fat
2.766g
15.558g
85%
Copper
0.403mg
1.144mg
82%
Vitamin B3
0.934mg
12.066mg
70%
Selenium
45.2µg
7.2µg
69%
Fats
7.03g
49.24g
65%
Monounsaturated fat
2.376g
24.426g
55%
Phosphorus
734mg
376mg
51%
Vitamin E
1.01mg
8.33mg
49%
Folate
52µg
240µg
47%
Vitamin B1
1.17mg
0.64mg
44%
Fiber
15.4g
8.5g
28%
Saturated fat
1.328g
6.279g
23%
Protein
17.3g
25.8g
17%
Carbs
66.22g
16.13g
17%
Calories
246kcal
567kcal
16%
Magnesium
235mg
168mg
16%
Vitamin B6
0.165mg
0.348mg
14%
Iron
5.41mg
4.58mg
10%
Vitamin B2
0.22mg
0.135mg
7%
Vitamin B5
1.494mg
1.767mg
5%
Potassium
566mg
705mg
4%
Choline
32.2mg
52.5mg
4%
Calcium
58mg
92mg
3%
Vitamin K
3.2µg
0µg
3%
Zinc
3.11mg
3.27mg
1%
Sodium
4mg
18mg
1%
Protein per 100 calories
7g
4.6g
N/A
Calories per 10 g protein
142kcal
220kcal
N/A
Weight per 100 calories
41g
18g
N/A
Unsaturated / Saturated Fat ratio
3.9
6.4
N/A
Net carbs
50.82g
7.63g
N/A
Sugar
1.45g
4.72g
N/A
Tryptophan
0.335mg
0.25mg
0%
Threonine
0.502mg
0.883mg
0%
Isoleucine
0.668mg
0.907mg
0%
Leucine
1.374mg
1.672mg
0%
Lysine
0.76mg
0.926mg
0%
Methionine
0.335mg
0.317mg
0%
Phenylalanine
0.908mg
1.377mg
0%
Valine
0.964mg
1.082mg
0%
Histidine
0.41mg
0.652mg
0%
Macronutrient Comparison
Macronutrient breakdown side-by-side comparison
3
17%
7%
66%
7%
3%
Protein:
17.3 g
Fats:
7.03 g
Carbs:
66.22 g
Water:
6.55 g
Other:
2.9 g
2
26%
49%
16%
7%
2%
Protein:
25.8 g
Fats:
49.24 g
Carbs:
16.13 g
Water:
6.5 g
Other:
2.33 g
Contains
more
Carbs Carbs
+310.5%
Contains
more
Other Other
+24.5%
Contains
more
Protein Protein
+49.1%
Contains
more
Fats Fats
+600.4%
Fat Type Comparison
Fat type breakdown side-by-side comparison
1
21%
37%
43%
Saturated fat:
Sat. Fat
1.328 g
Monounsaturated fat:
Mono. Fat
2.376 g
Polyunsaturated fat:
Poly. Fat
2.766 g
2
14%
53%
34%
Saturated fat:
Sat. Fat
6.279 g
Monounsaturated fat:
Mono. Fat
24.426 g
Polyunsaturated fat:
Poly. Fat
15.558 g
Contains
less
Sat. Fat Saturated fat
-78.9%
Contains
more
Mono. Fat Monounsaturated fat
+928%
Contains
more
Poly. Fat Polyunsaturated fat
+462.5%