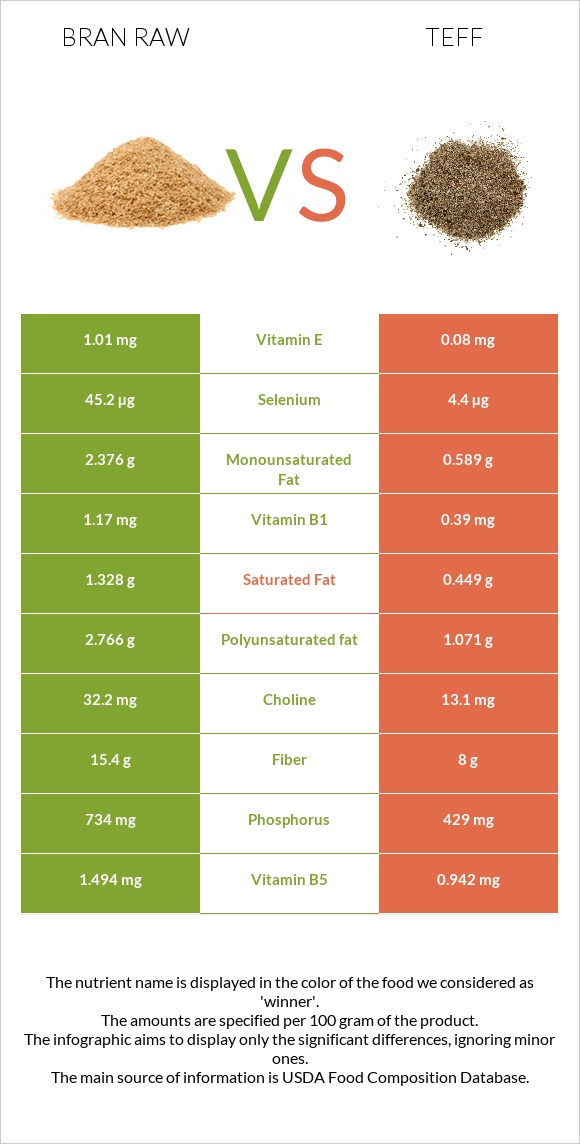
A recap on the differences between bran raw and teff Bran raw has more selenium, vitamin B1, phosphorus, and fiber; however, teff is higher in manganese, copper, iron, vitamin B6, vitamin B3, and calcium. Teff covers your daily manganese needs 157% more than bran raw. Teff contains 10 times less selenium than bran raw. Bran raw contains 45.2µg of selenium, while teff contains 4.4µg. Food varieties used in this article are Oat bran, raw and Teff, uncooked .
Infographic
Mineral Comparison
Mineral comparison score is based on the number of minerals by which one or the other food is richer. The "coverage" charts below show how much of the daily needs can be covered by 300 grams of the food.
5
100 g
300 g
1 cup - 94g
Magnesium
Magnesium
Calcium
Calcium
Potassium
Potassium
Iron
Iron
Copper
Copper
Zinc
Zinc
Phosphorus
Phosphorus
Sodium
Sodium
Manganese
Manganese
Selenium
Selenium
168%
17%
50%
203%
134%
85%
315%
0.52%
734%
247%
5
100 g
300 g
1 cup - 193g
Magnesium
Magnesium
Calcium
Calcium
Potassium
Potassium
Iron
Iron
Copper
Copper
Zinc
Zinc
Phosphorus
Phosphorus
Sodium
Sodium
Manganese
Manganese
Selenium
Selenium
131%
54%
38%
286%
270%
99%
184%
1.6%
1205%
24%
Vitamin Comparison
Vitamin comparison score is based on the number of vitamins by which one or the other food is richer. The "coverage" charts below show how much of the daily needs can be covered by 300 grams of the food.
5
100 g
300 g
1 cup - 94g
Vitamin C
Vit. C
Vitamin D
Vit. D
Vitamin A
Vit. A
Vitamin E
Vit. E
Vitamin B1
Vit. B1
Vitamin B2
Vit. B2
Vitamin B3
Vit. B3
Vitamin B5
Vit. B5
Vitamin B6
Vit. B6
Vitamin B12
Vit. B12
Vitamin K
Vit. K
Folate
Folate
0%
0%
0%
20%
293%
51%
18%
90%
38%
0%
8%
39%
3
100 g
300 g
1 cup - 193g
Vitamin C
Vit. C
Vitamin D
Vit. D
Vitamin A
Vit. A
Vitamin E
Vit. E
Vitamin B1
Vit. B1
Vitamin B2
Vit. B2
Vitamin B3
Vit. B3
Vitamin B5
Vit. B5
Vitamin B6
Vit. B6
Vitamin B12
Vit. B12
Vitamin K
Vit. K
Folate
Folate
0%
0%
0%
1.6%
98%
62%
63%
57%
111%
0%
4.8%
0%
All nutrients comparison - raw data values
Nutrient
DV% diff.
Manganese
5.63mg
9.24mg
157%
Selenium
45.2µg
4.4µg
74%
Vitamin B1
1.17mg
0.39mg
65%
Copper
0.403mg
0.81mg
45%
Phosphorus
734mg
429mg
44%
Fiber
15.4g
8g
30%
Iron
5.41mg
7.63mg
28%
Vitamin B6
0.165mg
0.482mg
24%
Starch
36.56g
15%
Vitamin B3
0.934mg
3.363mg
15%
Folate
52µg
13%
Magnesium
235mg
184mg
12%
Calcium
58mg
180mg
12%
Vitamin B5
1.494mg
0.942mg
11%
Polyunsaturated fat
2.766g
1.071g
11%
Protein
17.3g
13.3g
8%
Fats
7.03g
2.38g
7%
Calories
246kcal
367kcal
6%
Vitamin E
1.01mg
0.08mg
6%
Zinc
3.11mg
3.63mg
5%
Potassium
566mg
427mg
4%
Vitamin B2
0.22mg
0.27mg
4%
Saturated fat
1.328g
0.449g
4%
Monounsaturated fat
2.376g
0.589g
4%
Choline
32.2mg
13.1mg
3%
Carbs
66.22g
73.13g
2%
Vitamin K
3.2µg
1.9µg
1%
Fructose
0.47g
1%
Protein per 100 calories
7g
3.6g
N/A
Calories per 10 g protein
142kcal
276kcal
N/A
Weight per 100 calories
41g
27g
N/A
Unsaturated / Saturated Fat ratio
3.9
3.7
N/A
Net carbs
50.82g
65.13g
N/A
Sugar
1.45g
1.84g
N/A
Sodium
4mg
12mg
0%
Tryptophan
0.335mg
0.139mg
0%
Threonine
0.502mg
0.51mg
0%
Isoleucine
0.668mg
0.501mg
0%
Leucine
1.374mg
1.068mg
0%
Lysine
0.76mg
0.376mg
0%
Methionine
0.335mg
0.428mg
0%
Phenylalanine
0.908mg
0.698mg
0%
Valine
0.964mg
0.686mg
0%
Histidine
0.41mg
0.301mg
0%
Omega-3 - ALA
0.135g
N/A
Macronutrient Comparison
Macronutrient breakdown side-by-side comparison
3
17%
7%
66%
7%
3%
Protein:
17.3 g
Fats:
7.03 g
Carbs:
66.22 g
Water:
6.55 g
Other:
2.9 g
2
13%
2%
73%
9%
2%
Protein:
13.3 g
Fats:
2.38 g
Carbs:
73.13 g
Water:
8.82 g
Other:
2.37 g
Contains
more
Protein Protein
+30.1%
Contains
more
Fats Fats
+195.4%
Contains
more
Other Other
+22.4%
Contains
more
Carbs Carbs
+10.4%
Contains
more
Water Water
+34.7%
Fat Type Comparison
Fat type breakdown side-by-side comparison
2
21%
37%
43%
Saturated fat:
Sat. Fat
1.328 g
Monounsaturated fat:
Mono. Fat
2.376 g
Polyunsaturated fat:
Poly. Fat
2.766 g
1
21%
28%
51%
Saturated fat:
Sat. Fat
0.449 g
Monounsaturated fat:
Mono. Fat
0.589 g
Polyunsaturated fat:
Poly. Fat
1.071 g
Contains
more
Mono. Fat Monounsaturated fat
+303.4%
Contains
more
Poly. Fat Polyunsaturated fat
+158.3%
Contains
less
Sat. Fat Saturated fat
-66.2%