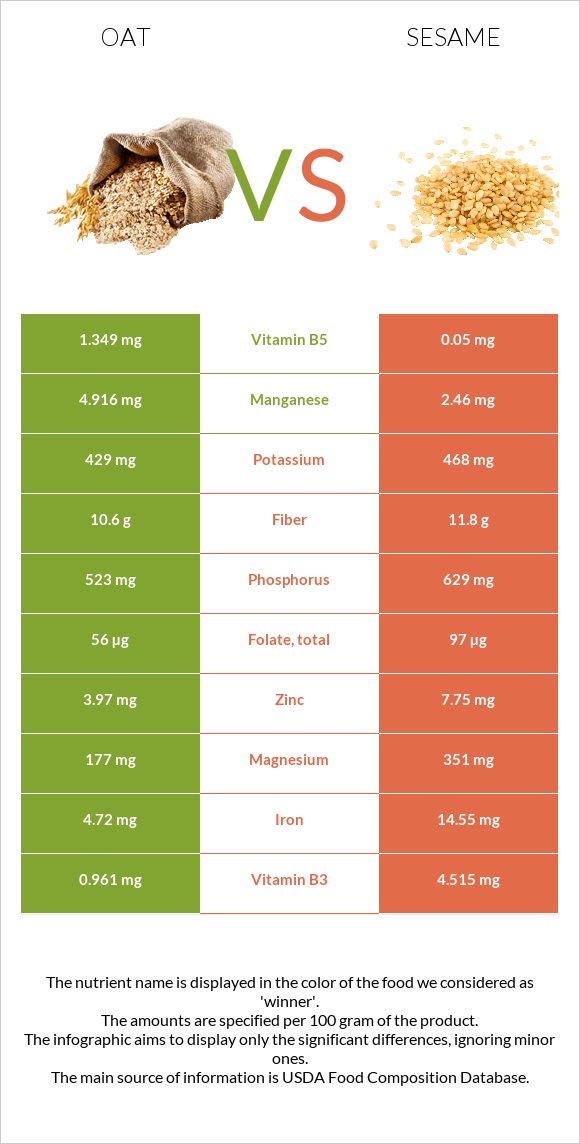
Differences between oats and sesame Oats have more manganese and vitamin B5, while sesame has more copper, iron, calcium, vitamin B6, magnesium, zinc, and vitamin B3. Sesame's daily need coverage for copper is 384% higher. Sesame contains 27 times less vitamin B5 than oats. Oats contain 1.349mg of vitamin B5, while sesame contains 0.05mg. The amount of saturated fat in oats is lower. The food types used in this comparison are Oats and Seeds, sesame seeds, whole, dried .
Infographic
Mineral Comparison
Mineral comparison score is based on the number of minerals by which one or the other food is richer. The "coverage" charts below show how much of the daily needs can be covered by 300 grams of the food.
2
100 g
300 g
1 cup - 156g
Magnesium
Magnesium
Calcium
Calcium
Potassium
Potassium
Iron
Iron
Copper
Copper
Zinc
Zinc
Phosphorus
Phosphorus
Sodium
Sodium
Manganese
Manganese
Selenium
Selenium
126%
16%
38%
177%
209%
108%
224%
0.26%
641%
0%
7
100 g
300 g
1 tbsp - 9g 1 cup - 144g
Magnesium
Magnesium
Calcium
Calcium
Potassium
Potassium
Iron
Iron
Copper
Copper
Zinc
Zinc
Phosphorus
Phosphorus
Sodium
Sodium
Manganese
Manganese
Selenium
Selenium
251%
293%
41%
546%
1361%
211%
270%
1.4%
321%
188%
Vitamin Comparison
Vitamin comparison score is based on the number of vitamins by which one or the other food is richer. The "coverage" charts below show how much of the daily needs can be covered by 300 grams of the food.
1
100 g
300 g
1 cup - 156g
Vitamin C
Vit. C
Vitamin D
Vit. D
Vitamin A
Vit. A
Vitamin E
Vit. E
Vitamin B1
Vit. B1
Vitamin B2
Vit. B2
Vitamin B3
Vit. B3
Vitamin B5
Vit. B5
Vitamin B6
Vit. B6
Vitamin B12
Vit. B12
Vitamin K
Vit. K
Folate
Folate
0%
0%
0%
0%
191%
32%
18%
81%
27%
0%
0%
42%
5
100 g
300 g
1 tbsp - 9g 1 cup - 144g
Vitamin C
Vit. C
Vitamin D
Vit. D
Vitamin A
Vit. A
Vitamin E
Vit. E
Vitamin B1
Vit. B1
Vitamin B2
Vit. B2
Vitamin B3
Vit. B3
Vitamin B5
Vit. B5
Vitamin B6
Vit. B6
Vitamin B12
Vit. B12
Vitamin K
Vit. K
Folate
Folate
0%
0%
0%
5%
198%
57%
85%
3%
182%
0%
0%
73%
All nutrients comparison - raw data values
Nutrient
DV% diff.
Copper
0.626mg
4.082mg
384%
Polyunsaturated fat
2.535g
21.773g
128%
Iron
4.72mg
14.55mg
123%
Manganese
4.916mg
2.46mg
107%
Calcium
54mg
975mg
92%
Fats
6.9g
49.67g
66%
Selenium
34.4µg
63%
Vitamin B6
0.119mg
0.79mg
52%
Magnesium
177mg
351mg
41%
Monounsaturated fat
2.178g
18.759g
41%
Zinc
3.97mg
7.75mg
34%
Vitamin B5
1.349mg
0.05mg
26%
Saturated fat
1.217g
6.957g
26%
Vitamin B3
0.961mg
4.515mg
22%
Phosphorus
523mg
629mg
15%
Carbs
66.27g
23.45g
14%
Folate
56µg
97µg
10%
Calories
389kcal
573kcal
9%
Vitamin B2
0.139mg
0.247mg
8%
Fiber
10.6g
11.8g
5%
Choline
25.6mg
5%
Protein
16.89g
17.73g
2%
Vitamin E
0.25mg
2%
Vitamin B1
0.763mg
0.791mg
2%
Potassium
429mg
468mg
1%
Protein per 100 calories
4.3g
3.1g
N/A
Calories per 10 g protein
230kcal
323kcal
N/A
Weight per 100 calories
26g
17g
N/A
Unsaturated / Saturated Fat ratio
3.9
5.8
N/A
Net carbs
55.67g
11.65g
N/A
Sugar
0.3g
N/A
Sodium
2mg
11mg
0%
Tryptophan
0.234mg
0.388mg
0%
Threonine
0.575mg
0.736mg
0%
Isoleucine
0.694mg
0.763mg
0%
Leucine
1.284mg
1.358mg
0%
Lysine
0.701mg
0.569mg
0%
Methionine
0.312mg
0.586mg
0%
Phenylalanine
0.895mg
0.94mg
0%
Valine
0.937mg
0.99mg
0%
Histidine
0.405mg
0.522mg
0%
Macronutrient Comparison
Macronutrient breakdown side-by-side comparison
2
17%
7%
66%
8%
2%
Protein:
16.89 g
Fats:
6.9 g
Carbs:
66.27 g
Water:
8.22 g
Other:
1.72 g
3
18%
50%
23%
5%
4%
Protein:
17.73 g
Fats:
49.67 g
Carbs:
23.45 g
Water:
4.69 g
Other:
4.46 g
Contains
more
Carbs Carbs
+182.6%
Contains
more
Water Water
+75.3%
Contains
more
Fats Fats
+619.9%
Contains
more
Other Other
+159.3%
~equal in
Protein
~17.73g
Fat Type Comparison
Fat type breakdown side-by-side comparison
1
21%
37%
43%
Saturated fat:
Sat. Fat
1.217 g
Monounsaturated fat:
Mono. Fat
2.178 g
Polyunsaturated fat:
Poly. Fat
2.535 g
2
15%
40%
46%
Saturated fat:
Sat. Fat
6.957 g
Monounsaturated fat:
Mono. Fat
18.759 g
Polyunsaturated fat:
Poly. Fat
21.773 g
Contains
less
Sat. Fat Saturated fat
-82.5%
Contains
more
Mono. Fat Monounsaturated fat
+761.3%
Contains
more
Poly. Fat Polyunsaturated fat
+758.9%