Wheat vs Oats - Health impact and Nutrition Comparison


Summary
Oats are higher in calories, fats, and protein and have a higher glycemic index. It is richer in phosphorus, copper, magnesium, and vitamins B1, B2, B5, and folate. Comparatively, wheat is richer in fiber, zinc, selenium, iron, and vitamins B3 and B6. Wheat is cheaper.
Introduction
Oat is a cereal grain that originated in the Near East and then spread to the Middle Eastern regions and Europe. Oats are usually processed and are available mainly as oatmeal or rolled oats. Oats grow in temperate regions, and the countries with the highest cultivation of oats are Russia and Canada.
Oats are the origin of multiple foods, such as rolled oats, oatmeal, oat flour, oat milk, and other foods. In addition to human usage, oats are also used in livestock feeding.
Oats can also be used in beverage preparations; one of the most common usages of oats is the preparation of oatmeal stout, which is a dark beer. Other alcoholic beverages use oats for blending whiskey.
On the other hand, there is wheat, a cereal grain that is considered a staple food. Its origin points to the fertile crescent, and archeologists pinpoint the years of wheat cultivation around 9500 BC. Wheat is an essential part of the Western and Mediterranean diets; it is widely spread worldwide. Wheat provides flour, which is the main ingredient in bread making. This shows how essential wheat is to the majority of the world. One of the most famous types of wheat is durum. It is high in gluten protein, which makes this type of wheat flour perfect for breadmaking and pasta preparations, and this is due to the adhesive property of gluten that keeps the dough together.
Varieties and Culinary Use
There are different types of oat preparations in the culinary world. Oat is the cultivated cereal grain, and different processes are done on these oats to obtain the following foods: overnight oats, oatmeal, rolled oats, masala oats, and porridge oats.
Overnight oats are a breakfast oat; soaking oats overnight has its digestive and gastronomic benefits. Soaking oats makes them easier to digest, and it makes the oats softer to eat and absorb more flavors.
Oatmeal is made by crushing oats, which makes the preparation of oatmeal easier and reduces the cooking or preparation time of oatmeal to 10 minutes instead of overnight soaking or hours of cooking of regular oats.
Wheat can be mechanically processed into several other things: flour, semolina, bulgur, and bran. Each can be processed into several other elements like dough, bread, pasta, and breakfast components. Malt, which is used in making beer and whiskey, comes from wheat.
Price
Wheat is cheaper compared to oats. However, in different parts of the world, these prices can vary. In addition to that, the price also varies with the processing done on oats and wheat.
In this article, we will discuss the difference between oat and wheat based on their difference in nutritional content, diet and weight loss usage, and health impacts.
Nutritional Content Comparison
In this article, we are taking into consideration durum wheat and whole oats. The comparison is based on 100g of each.
An important note is that both wheat and oats are in their pre-cooked stage compared to this article. 100g of cooked wheat or oat is different from 100g of cooked wheat or oat. For the cooking process, the water content and the nutritional values all vary accordingly.
Glycemic Index
Wheat has a lower glycemic index compared to oat. Wheat is classified as a low glycemic index food, whereas oats are classified as a medium glycemic index food. It is important to note that the glycemic index of wheat is 50, meaning that it is in the higher margins of the low glycemic index foods.
Calories
Oats are higher in calories compared to wheat. Oats contain 390 calories per 100g, whereas wheat contains 340 calories per 100g.
Carbs
Wheat is higher in carbs compared to oats. It is important to mention that both wheat and oats are high in carbs. Most of their weight is made of carbs rather than any other macronutrient or water.
Fats
Oats are higher in fats than wheat. Oats contain nearly three times as much fat as wheat. However, mostly these fats are unsaturated fatty acids.
Proteins
Oats are higher in protein than wheat. The main protein of oats is avenin, and the main component of wheat protein is gluten. Gluten content is important for people who have celiac disease or other gluten intolerances.
Fibers
Wheat is very rich in fiber. Wheat has 34 times more fiber than oats. The fiber content of wheat gives it high health benefits, which are mostly related to the digestive system's well-being.
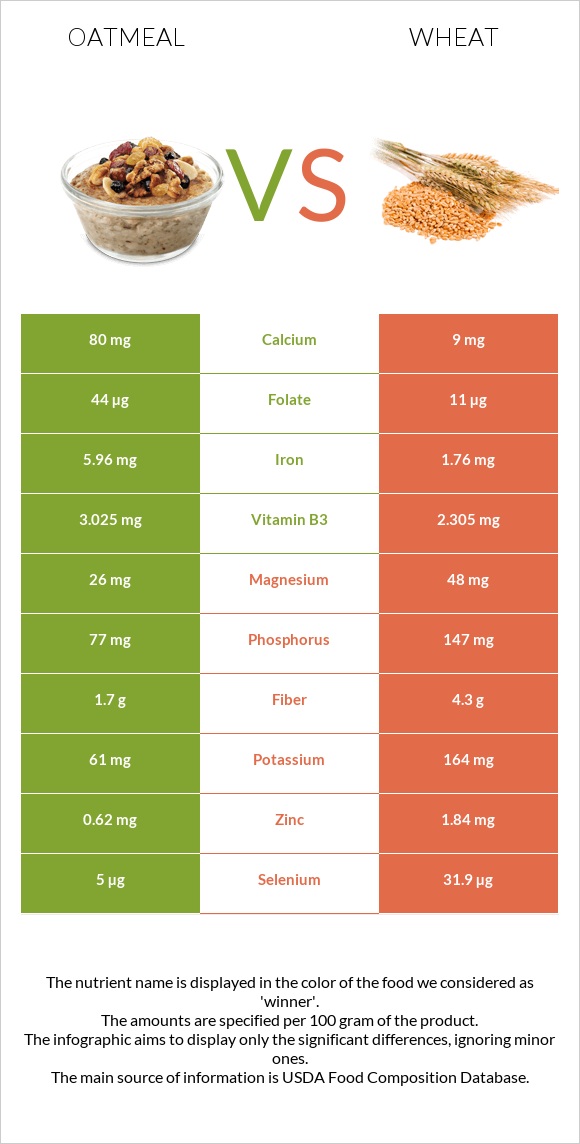
Minerals
Oats are richer in phosphorus, copper, magnesium, and manganese. On the other hand, wheat is richer in zinc, selenium, and iron. They are rich in certain minerals that satisfy more than 50% of the required daily value. These minerals are manganese, copper, iron, and selenium.
Below we can see the comparative diagrams of minerals between oat and wheat.
Mineral Comparison
Contains
more
CalciumCalcium
+788.9%
Contains
more
IronIron
+238.6%
Contains
more
MagnesiumMagnesium
+84.6%
Contains
more
PotassiumPotassium
+168.9%
Contains
more
CopperCopper
+213.6%
Contains
more
ZincZinc
+196.8%
Contains
more
PhosphorusPhosphorus
+90.9%
Contains
less
SodiumSodium
-83.7%
Contains
more
ManganeseManganese
+84.6%
Contains
more
SeleniumSelenium
+538%
Vitamins
The vitamin profile of both of these is not as rich in content and variability. However, they have their highlights. Oats are richer in vitamins B1, B2, B5, and folate. In comparison, wheat is richer in vitamins B3 and B6.
Below we can see the comparative diagrams of vitamins between oats and wheat.
Vitamin Comparison
Contains
more
Vitamin AVitamin A
+∞%
Contains
more
Vitamin B1Vitamin B1
+173.7%
Contains
more
Vitamin B2Vitamin B2
+616.7%
Contains
more
Vitamin B3Vitamin B3
+31.2%
Contains
more
Vitamin B5Vitamin B5
+∞%
Contains
more
Vitamin B6Vitamin B6
+314.3%
Contains
more
Vitamin KVitamin K
+∞%
Contains
more
FolateFolate
+300%
Contains
more
Vitamin EVitamin E
+242.9%
Diets and Weight Loss
One of the most important differences between oats and wheat is the presence of gluten. The major protein content of wheat is gluten, which gives it its adhesive and sticky properties that are important in pasta dough preparation and breadmaking. On the other hand, oats don't contain gluten, making oats a gluten-free alternative to wheat. Oat flour doesn't contain gluten, which is a good alternative to wheat flour, especially semolina. However, the gluten-free property affects the process of breadmaking, for example, because gluten is one of the constituents that keep the bread held together and prevent it from crumbling and drying up.
Consider the consumption of these products during the various diets.
- Gluten-free diet. Gluten is the main component of wheat; thus, wheat cannot be consumed in gluten-free diets. On the other hand, oats can be consumed in gluten-free diets and are recommended as optional alternatives to wheat.
- Keto diet. Wheat and oats are high in carbs; thus, they cannot be consumed in keto diets. However, some foods and snacks that have wheat or oats in them can be eaten. It is important to consider the content of wheat or oats, basically the general carb content of these foods, for which alternatives exist. For example, for wheat or oat flour, almond flour can be used.
- A Dukan diet consists of low carbohydrates, high protein, and low fat. Only four tablespoons of wheat gluten flour are permitted each week in all phases (used in baking to help make desserts). As for oats, around one and a half tablespoons of oat bran are allowed daily.
- In the Mediterranean diet, wheat and oats are recommended as traditional foods from Greece, Italy, and other Mediterranean countries.
- In spite of the fact that oats are a non-fattening, healthy food for a more mainstream diet, they do contain anti-nutrients that the Paleo diet is aiming to avoid, such as phytic acid, lectins, and avenin. In contrast, wheat is recommended during this diet.
- Because intermittent fasting regulates when you eat rather than what you consume, it is more like an eating habit than a diet. It is therefore possible to consume either of these products while following this diet.
- Vegan diet. Wheat and oats can be consumed in a vegan diet. In addition to that, wheat and oat milk are available as alternatives to dairy milk. In turn, each of them comes with its differences in taste, flavor, and nutritional values. However, both are good alternatives to dairy milk.
- DASH (Dietary Approaches to Stop Hypertension) diets also allow them to be consumed.
Health impacts
Let's go over health impact differences.
Vitamin Properties
The vitamins B3 and B6 in wheat are more abundant than those in oats, which are rich in B1, B2, B5, and B9, as mentioned above. Moderate consumption of wheat and oats may prevent a deficiency of these vitamins.
Niacin (vitamin B3) deficiency can lead to pellagra. Symptoms of pellagra include diarrhea, dementia, and dermatitis ("the three Ds"). If not treated, it may cause death.
The most common cause of pyridoxine (vitamin B6) deficiency is isoniazid therapy (this drug is used in the treatment of tuberculosis). Symptoms of vitamin B6 deficiency include sideroblastic anemia, convulsions, cheilosis, and stomatitis.
The most prevalent reason for thiamine (vitamin B1) deficiency is alcoholism. Vitamin B1 deficiency may cause beri-beri (peripheral neuropathy, which may cause prickling or tingling in your feet or hands), confabulation (a patient creates false memories without the desire to deceive), and psychosis.
Riboflavin (vitamin B2) deficiency may cause corneal neovascularization (which is dangerous for vision); its symptoms include cheilosis, stomatitis, and a magenta-colored tongue.
The most common causes of folic acid (vitamin B9) deficiency are alcoholism, pregnancy (body stores are depleted in 3 months), and hemodialysis. A deficiency of vitamin B9 may cause megaloblastic anemia, and a deficiency in early pregnancy causes neural tube defects in the fetus.
Cardiovascular Health
Wheat germ and oats contain some proteins that may inhibit ACE (angiotensin-converting enzyme), similar to antihypertensive medications (e.g., Captopril, Lisinopril, Perindopril, etc.) (1, 2).
Besides this, wheat and oats are high in dietary fiber, which may reduce blood pressure and help control weight (3, 4).
According to studies, the regular consumption of wholemeal wheat foods and oat bran may reduce LDL (bad cholesterol) levels in plasma, which is important for people with coronary artery disease (5, 6, 7).
In addition, high-dose niacin, found in wheat, can be used to treat hyperlipidemia.
In conclusion, consumption of these products may decrease cardiovascular risk.
Digestive Health
The consumption of oats has been linked to improved intestinal microbiota (8).
Wheat consumption is associated with decreased risk of diverticulosis. Diverticulosis is associated with low fiber intake over long durations of time. Full-grain wheat, with its husk and bran, is the optimal source of fiber for the different wheat varieties (9).
Oats have similar properties to wheat regarding the overall reduction of risk of diverticulosis. In addition to that, it reduces lipid absorption, having a health-positive effect on overall metabolism (10).
Celiac disease
Wheat protein is mostly made of gluten, which induces inflammation in celiac disease. Thus, it is highly important not to consume gluten for people with celiac disease (11).
Oats are gluten-free, and most people with gluten-related disorders can consume oats.
Diabetes
In patients with uncontrolled type 2 diabetes, blood glucose and cholesterol levels were shown to be lower. Oat is linked to the management of hypercholesterolemia and hyperglycemia (12).
Consumption of whole-grain cereals such as oats and wheat reduces the incidence of developing type 2 diabetes. In addition to that, it keeps blood glucose and triglyceride levels in control. Fatty acid absorption is reduced in oat-based diets compared to other types of cereal grains (13).
Cancer
Oats contain beta-glucans; these beta-glucans have anti-carcinogenic properties against lung cancer cells (14).
Wheat class affects the effect of wheat on the risk of developing colon cancer. Whole-grain brown wheat has been shown to have protective properties against the development of colon cancer (15).
References
- https://www.sciencedirect.com/science/article/abs/pii/S2212429217301359
- https://pubs.acs.org/doi/abs/10.1021/jf9018245
- https://www.sciencedirect.com/science/article/abs/pii/S0002822306013873
- https://www.sciencedirect.com/science/article/abs/pii/S0939475321001836
- https://www.nejm.org/doi/full/10.1056/nejm199001183220302
- https://pubmed.ncbi.nlm.nih.gov/33762150/
- https://www.sciencedirect.com/science/article/abs/pii/S0939475309000799
- https://www.ncbi.nlm.nih.gov/pmc/articles/PMC8625765/
- https://pubmed.ncbi.nlm.nih.gov/26267774/
- https://pubmed.ncbi.nlm.nih.gov/15471177/
- https://www.ncbi.nlm.nih.gov/pmc/articles/PMC6647104/
- https://pubmed.ncbi.nlm.nih.gov/26690472/
- https://pubmed.ncbi.nlm.nih.gov/32641435/
- https://pubmed.ncbi.nlm.nih.gov/28756506/
- https://pubmed.ncbi.nlm.nih.gov/24820704/

Infographic
All nutrients comparison - raw data values
| Nutrient | |
|
DV% diff. |
| Iron | 5.96mg | 1.76mg | 53% |
| Selenium | 5µg | 31.9µg | 49% |
| Manganese | 0.558mg | 1.03mg | 21% |
| Vitamin B6 | 0.29mg | 0.07mg | 17% |
| Copper | 0.066mg | 0.207mg | 16% |
| Vitamin A | 130µg | 14% | |
| Vitamin B1 | 0.26mg | 0.095mg | 14% |
| Vitamin B2 | 0.215mg | 0.03mg | 14% |
| Zinc | 0.62mg | 1.84mg | 11% |
| Fiber | 1.7g | 4.3g | 10% |
| Phosphorus | 77mg | 147mg | 10% |
| Folate | 44µg | 11µg | 8% |
| Protein | 2.37g | 5.71g | 7% |
| Calcium | 80mg | 9mg | 7% |
| Vitamin B5 | 0.317mg | 6% | |
| Carbs | 11.67g | 27.6g | 5% |
| Magnesium | 26mg | 48mg | 5% |
| Vitamin B3 | 3.025mg | 2.305mg | 5% |
| Starch | 10.37g | 4% | |
| Calories | 68kcal | 132kcal | 3% |
| Potassium | 61mg | 164mg | 3% |
| Sodium | 49mg | 8mg | 2% |
| Fats | 1.36g | 0.83g | 1% |
| Vitamin E | 0.07mg | 0.24mg | 1% |
| Choline | 4.7mg | 1% | |
| Saturated fat | 0.226g | 0.077g | 1% |
| Monounsaturated fat | 0.391g | 0.084g | 1% |
| Polyunsaturated fat | 0.426g | 0.243g | 1% |
| Protein per 100 calories | 3.5g | 4.3g | N/A |
| Calories per 10 g protein | 287kcal | 231kcal | N/A |
| Weight per 100 calories | 147g | 76g | N/A |
| Net carbs | 9.97g | 23.3g | N/A |
| Sugar | 0.46g | 3.07g | N/A |
| Vitamin K | 0.4µg | 0% | |
| Trans fat | 0.003g | 0.002g | N/A |
| Tryptophan | 0.04mg | 0.051mg | 0% |
| Threonine | 0.083mg | 0.172mg | 0% |
| Isoleucine | 0.105mg | 0.22mg | 0% |
| Leucine | 0.2mg | 0.432mg | 0% |
| Lysine | 0.135mg | 0.161mg | 0% |
| Methionine | 0.04mg | 0.097mg | 0% |
| Phenylalanine | 0.13mg | 0.3mg | 0% |
| Valine | 0.151mg | 0.267mg | 0% |
| Histidine | 0.057mg | 0.147mg | 0% |
Macronutrient Comparison
| Contains more FatsFats | +63.9% |
| Contains more WaterWater | +28.9% |
| Contains more ProteinProtein | +140.9% |
| Contains more CarbsCarbs | +136.5% |
| Contains more OtherOther | +19.3% |
Fat Type Comparison
| Contains more Mono. FatMonounsaturated fat | +365.5% |
| Contains more Poly. FatPolyunsaturated fat | +75.3% |
| Contains less Sat. FatSaturated fat | -65.9% |
People also compare


References
All the values for which the sources are not specified explicitly are taken from FDA’s Food Central. The exact link to the food presented on this page can be found below.
- Oatmeal - https://fdc.nal.usda.gov/fdc-app.html#/food-details/171662/nutrients
- Wheat - https://fdc.nal.usda.gov/fdc-app.html#/food-details/169744/nutrients
All the Daily Values are presented for males aged 31-50, for 2000-calorie diets.