Parsley vs. Parsnip — Health Impact and Nutrition Comparison


Summary
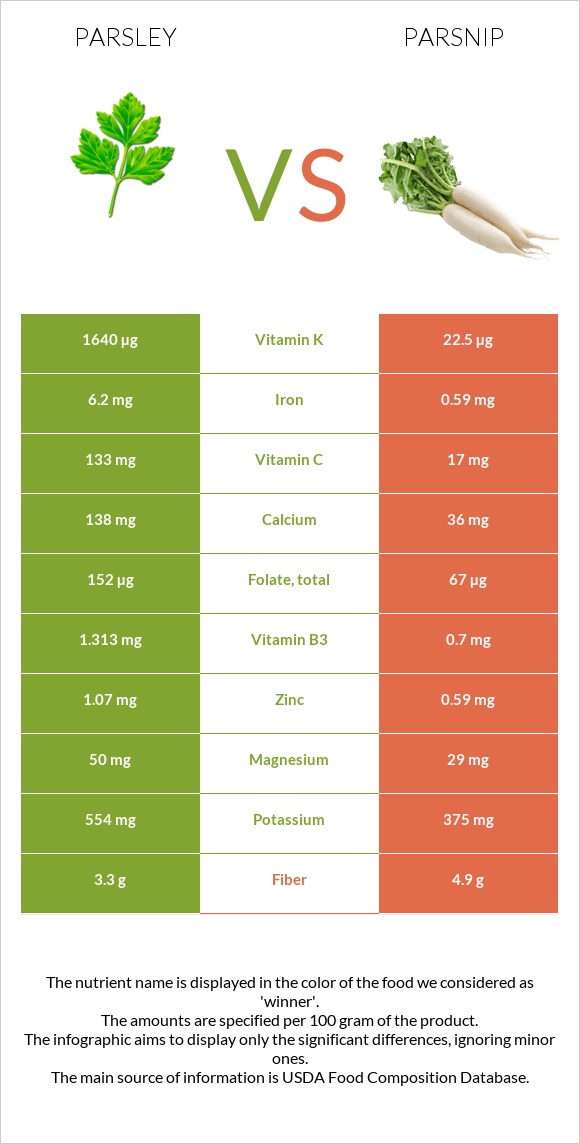
Parsley contains more Vitamin K, Vitamin C, and B-complex vitamins as well as more iron, calcium, potassium, and magnesium compared to parsnip. Specifically, it provides around 70 times more Vitamin K, 6 times more Vitamin C, 9 times more iron, and 2 times more calcium.
Parsnip is two times higher in calories and carbs. The glycemic index of parsnip is also higher than the glycemic index of parsley.
Introduction
In this article, we will compare parsnip and parsley by referring to their nutritional profiles while also discussing the negative and positive effects on health.
What's the Actual Difference?
Parsnips and parsley have different textures, tastes, and botanical classifications.
The main difference between parsnip and parsley is that parsnips are biennial plants that belong to the Pastinaca Genus within the Apiaceae family, while parsley is a leafy herb and vegetable that also belongs to the Apiaceae family but comes from the Petroselinum genus.
Parsley has a clean and peppery taste, green color, and feather-like leaves.
Parsnips have white skin and are similar in texture to carrots, although they are not as sweet.
Nutrition
In this section, we will look into the nutritional differences between fresh parsley and raw parsnips.
The serving size of parsley is one cup, which is around 60 grams. Usually, parsnips are served in bigger portions ranging between 80-130 grams. One cup slices of parsnips weighs 133 grams.
Macronutrients
Like most vegetables, water makes up a significant portion of the nutritional composition of parsley and parsnips. Parsnips consist of 80% water and 18% carbs, while parsley consists of 88% water and 6% carbs.
Macronutrient Comparison
Contains
more
ProteinProtein
+147.5%
Contains
more
FatsFats
+163.3%
Contains
more
OtherOther
+124.5%
Contains
more
CarbsCarbs
+184.2%
Calories
Both parsnip and parsley are low in calories; however, parsnip provides two times more calories than parsley.
A 100-gram serving of parsnips provides 75 calories, whereas the same serving of parsley provides only 36 calories.
Carbs
Both parsnip and parsley are low-carb foods; however, parsnip contains two times more carbs than parsley.
Parsnips contain 17.99g of carbs per 100-gram serving, whereas parsley contains 6.33g of carbs per same 100-gram serving. Of that 17.99g, 5 grams are fiber, and 13 grams are net carbs. Parsley also provides about 3.3 grams of fiber per 100-gram serving.
Fats
A 100-gram serving of both parsnip and parsley contains less than 1g of fat. Parsnip contains 0.3g of fat, and parsley contains 0.79g.
Parsnip and parsley contain no cholesterol.
Protein
Parsnip and parsley provide negligible amounts of protein.
Vitamins
The vitamin content of parsley is richer than that of parsnip.
Parsley contains about 70 times more Vitamin K, 6 times more Vitamin C, as well as more Vitamin B3, Vitamin B2, Vitamin A, and folate.
Parsley falls in the range of the top 10% of foods as a source of Vitamin C and Vitamin A. 100g of parsley can fully cover your daily Vitamin A need.
On the other hand, parsnip contains slightly more Vitamin E and Vitamin B5.
Vitamin Comparison
Contains
more
Vitamin CVitamin C
+682.4%
Contains
more
Vitamin AVitamin A
+∞%
Contains
more
Vitamin B2Vitamin B2
+96%
Contains
more
Vitamin B3Vitamin B3
+87.6%
Contains
more
Vitamin KVitamin K
+7188.9%
Contains
more
FolateFolate
+126.9%
Contains
more
Vitamin EVitamin E
+98.7%
Contains
more
Vitamin B5Vitamin B5
+50%
Minerals
Parsey is richer in minerals than a parsnip. It contains 9 times more iron, 2 times more calcium, as well as more zinc, magnesium, and potassium.
Parsnip has more phosphorus and less sodium than parsley. Parsley falls in the range of the top 9% of foods as a source of iron.
Mineral Comparison
Contains
more
MagnesiumMagnesium
+72.4%
Contains
more
CalciumCalcium
+283.3%
Contains
more
PotassiumPotassium
+47.7%
Contains
more
IronIron
+950.8%
Contains
more
CopperCopper
+24.2%
Contains
more
ZincZinc
+81.4%
Contains
more
PhosphorusPhosphorus
+22.4%
Contains
less
SodiumSodium
-82.1%
Contains
more
ManganeseManganese
+250%
Contains
more
SeleniumSelenium
+1700%
Glycemic Index
Parsley is considered a low glycemic index food, and parsnip is considered a high glycemic index food.
The glycemic index of parsnip is almost three times higher than that of parsley.
The GI of parsnip is equal to 97, whereas the GI of parsley is equal to 32.
Acidity
One way to understand the acidity of foods is through their potential renal acid load (PRAL) value. The PRAL value shows how much acid or base the given food produces inside the organism.
The PRAL values of parsley and parsnip are -11.1 and -5.9, respectively, which means that parsley has a greater potential to alkalize the body.
Health Impact
Cardiovascular Health
Parsley and parsnip offer different nutritional profiles and potential benefits for cardiovascular health:
Parsley:
- Parsley is rich in antioxidants, including flavonoids and carotenoids. These antioxidants help reduce inflammation and oxidative stress in the body, which are linked to cardiovascular disease.
- It contains vitamin K, which plays a role in blood clotting and may help prevent arterial calcification, a risk factor for heart disease (1).
- Parsley is also a good source of folate, which helps lower levels of homocysteine in the blood. Elevated homocysteine levels are associated with an increased risk of cardiovascular disease (2).
- Parsley possesses diuretic properties that help eliminate excess water from the body, particularly benefiting hypertensive individuals and those with heart failure (3).
Parsnip:
- Parsnip is a good source of dietary fiber, which can help lower LDL ("bad" cholesterol) levels and improve heart health. High fiber intake is associated with a reduced risk of cardiovascular disease (4).
- It contains potassium, which helps regulate blood pressure. Maintaining healthy blood pressure levels is essential for reducing the risk of heart disease and stroke (5).
- Parsnip also provides antioxidant properties and supports overall cardiovascular health.
In summary, both parsley and parsnip can be part of a heart-healthy diet due to their nutrient content. Parsley offers antioxidants and vitamin K, while parsnip provides fiber, potassium, and vitamin C. Including a variety of vegetables, along with other heart-healthy foods, can contribute to cardiovascular health and reduce the risk of heart disease.
Cancer
The American Institute for Cancer Research states that parsnip contains cancer-fighting folate (6). Furthermore, they are high in sulforaphane, which has been shown in studies to be effective in treating breast, colon, prostate, and ovarian cancers. Parsnip is also high in Vitamin C, an antioxidant with free-radical scavenging properties (7). As a result, it protects against cancer. One study shows that polyacetylenes extracted from parsnips have chemoprotective and cytotoxic activity (8).
Diabetes
Parsley is extremely rich in Vitamin A. According to a new study, Vitamin A improves the function of the insulin-producing-cell (9). The researchers first discovered that insulin-producing beta-cells have a high Vitamin A cell surface receptor concentration.
Several studies have found a direct link between eating fiber-rich foods like parsnips and a lower risk of type 2 diabetes (10). One cup of parsnips contains 7 grams of soluble fiber, which may aid in cholesterol reduction and blood sugar regulation (11).
Bone Health
Parsnips are high in magnesium and calcium, which are necessary for bone development. One cup of chopped parsnips has more than 45 milligrams of magnesium. Parsnips provide more than 10% of an adult's magnesium needs at the recommended daily intake of 320-420mg. One study indicates that daily magnesium recommended intake can help build and maintain strong bones (12).
Another study shows that parsley consumption has decreased the chances of bone fractures in postmenopausal women with osteoporosis (13).
Side Effects
Allergy
When applied to the skin, parsnip is relatively safe. However, parsnip can cause hypersensitivity to the sun.
Parsley may commonly cause food allergy symptoms in sensitive individuals, particularly those with allergic rhinitis caused by a pollen allergy (14).
References
- https://www.ncbi.nlm.nih.gov/pmc/articles/PMC4600246/
- https://www.ncbi.nlm.nih.gov/pmc/articles/PMC3026708/
- https://pubmed.ncbi.nlm.nih.gov/11849841/
- https://www.researchgate.net/publication/257422613_Parsnip_Pastinaca_sativa_L_Dietary_fibre_composition_and_physicochemical_characterization_of_its_homogenized_suspensions
- https://www.health.harvard.edu/heart-health/potassium-lowers-blood-pressure
- https://www.aicr.org/resources/blog/the-joy-of-parsnips/
- https://pubmed.ncbi.nlm.nih.gov/29719430/
- https://pubmed.ncbi.nlm.nih.gov/21114468/
- https://www.sciencedaily.com/releases/2017/06/170613111649.htm
- https://pubmed.ncbi.nlm.nih.gov/32142510/
- https://diabetesjournals.org/care/article/27/2/362/28291/
- https://onlinelibrary.wiley.com/doi/epdf/10.1111/mcn.12368
- https://pubmed.ncbi.nlm.nih.gov/18922041/
- https://pubmed.ncbi.nlm.nih.gov/27795547/

Infographic
All nutrients comparison - raw data values
| Nutrient | |
|
DV% diff. |
| Vitamin K | 1640µg | 22.5µg | 1348% |
| Vitamin C | 133mg | 17mg | 129% |
| Iron | 6.2mg | 0.59mg | 70% |
| Vitamin A | 421µg | 0µg | 47% |
| Folate | 152µg | 67µg | 21% |
| Manganese | 0.16mg | 0.56mg | 17% |
| Calcium | 138mg | 36mg | 10% |
| Fiber | 3.3g | 4.9g | 6% |
| Magnesium | 50mg | 29mg | 5% |
| Potassium | 554mg | 375mg | 5% |
| Vitamin E | 0.75mg | 1.49mg | 5% |
| Protein | 2.97g | 1.2g | 4% |
| Carbs | 6.33g | 17.99g | 4% |
| Zinc | 1.07mg | 0.59mg | 4% |
| Vitamin B2 | 0.098mg | 0.05mg | 4% |
| Vitamin B3 | 1.313mg | 0.7mg | 4% |
| Vitamin B5 | 0.4mg | 0.6mg | 4% |
| Copper | 0.149mg | 0.12mg | 3% |
| Selenium | 0.1µg | 1.8µg | 3% |
| Calories | 36kcal | 75kcal | 2% |
| Phosphorus | 58mg | 71mg | 2% |
| Sodium | 56mg | 10mg | 2% |
| Choline | 12.8mg | 2% | |
| Fats | 0.79g | 0.3g | 1% |
| Polyunsaturated fat | 0.124g | 0.047g | 1% |
| Protein per 100 calories | 8.3g | 1.6g | N/A |
| Calories per 10 g protein | 121kcal | 625kcal | N/A |
| Weight per 100 calories | 278g | 133g | N/A |
| Net carbs | 3.03g | 13.09g | N/A |
| Sugar | 0.85g | 4.8g | N/A |
| Vitamin B1 | 0.086mg | 0.09mg | 0% |
| Vitamin B6 | 0.09mg | 0.09mg | 0% |
| Saturated fat | 0.132g | 0.05g | 0% |
| Monounsaturated fat | 0.295g | 0.112g | 0% |
| Tryptophan | 0.045mg | 0% | |
| Threonine | 0.122mg | 0% | |
| Isoleucine | 0.118mg | 0% | |
| Leucine | 0.204mg | 0% | |
| Lysine | 0.181mg | 0% | |
| Methionine | 0.042mg | 0% | |
| Phenylalanine | 0.145mg | 0% | |
| Valine | 0.172mg | 0% | |
| Histidine | 0.061mg | 0% |
Fat Type Comparison
| Contains more Mono. FatMonounsaturated fat | +163.4% |
| Contains more Poly. FatPolyunsaturated fat | +163.8% |
| Contains less Sat. FatSaturated fat | -62.1% |
People also compare


References
All the values for which the sources are not specified explicitly are taken from FDA’s Food Central. The exact link to the food presented on this page can be found below.
- Parsley - https://fdc.nal.usda.gov/fdc-app.html#/food-details/170416/nutrients
- Parsnip - https://fdc.nal.usda.gov/fdc-app.html#/food-details/170417/nutrients
All the Daily Values are presented for males aged 31-50, for 2000-calorie diets.