How are parsnip and broccoli different? Parsnip is richer in manganese, fiber, and copper, while broccoli is higher in vitamin C, vitamin K, vitamin A, vitamin B6, and vitamin B2. Broccoli covers your daily need for vitamin C, 80% more than parsnip. Parsnip contains 3 times more manganese than broccoli. Parsnip contains 0.56mg of manganese, while broccoli contains 0.21mg. Parsnip has a higher glycemic index (97) than broccoli (32). Parsnips, raw and Broccoli, raw types were used in this article.
Infographic
Mineral Comparison
Mineral comparison score is based on the number of minerals by which one or the other food is richer. The "coverage" charts below show how much of the daily needs can be covered by 300 grams of the food.
6
100 g
300 g
1 cup slices - 133g
Magnesium
Magnesium
Calcium
Calcium
Potassium
Potassium
Iron
Iron
Copper
Copper
Zinc
Zinc
Phosphorus
Phosphorus
Sodium
Sodium
Manganese
Manganese
Selenium
Selenium
21%
11%
33%
22%
40%
16%
30%
1.3%
73%
9.8%
3
100 g
300 g
1 spear (about 5" long) - 31g 0.5 cup, chopped or diced - 44g 1 cup chopped - 91g 1 NLEA serving - 148g 1 stalk - 151g 1 bunch - 608g
Magnesium
Magnesium
Calcium
Calcium
Potassium
Potassium
Iron
Iron
Copper
Copper
Zinc
Zinc
Phosphorus
Phosphorus
Sodium
Sodium
Manganese
Manganese
Selenium
Selenium
15%
14%
28%
27%
16%
11%
28%
4.3%
27%
14%
Vitamin Comparison
Vitamin comparison score is based on the number of vitamins by which one or the other food is richer. The "coverage" charts below show how much of the daily needs can be covered by 300 grams of the food.
2
100 g
300 g
1 cup slices - 133g
Vitamin C
Vit. C
Vitamin D
Vit. D
Vitamin A
Vit. A
Vitamin E
Vit. E
Vitamin B1
Vit. B1
Vitamin B2
Vit. B2
Vitamin B3
Vit. B3
Vitamin B5
Vit. B5
Vitamin B6
Vit. B6
Vitamin B12
Vit. B12
Vitamin K
Vit. K
Folate
Folate
57%
0%
0%
30%
23%
12%
13%
36%
21%
0%
56%
50%
5
100 g
300 g
1 spear (about 5" long) - 31g 0.5 cup, chopped or diced - 44g 1 cup chopped - 91g 1 NLEA serving - 148g 1 stalk - 151g 1 bunch - 608g
Vitamin C
Vit. C
Vitamin D
Vit. D
Vitamin A
Vit. A
Vitamin E
Vit. E
Vitamin B1
Vit. B1
Vitamin B2
Vit. B2
Vitamin B3
Vit. B3
Vitamin B5
Vit. B5
Vitamin B6
Vit. B6
Vitamin B12
Vit. B12
Vitamin K
Vit. K
Folate
Folate
297%
0%
10%
16%
18%
27%
12%
34%
40%
0%
254%
47%
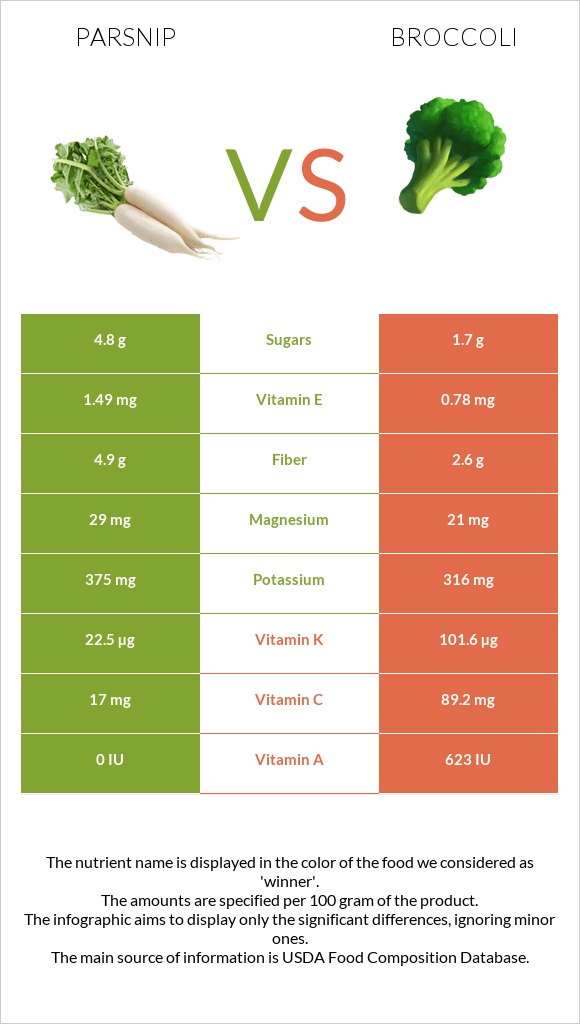
All nutrients comparison - raw data values
Nutrient
DV% diff.
Vitamin C
17mg
89.2mg
80%
Vitamin K
22.5µg
101.6µg
66%
Manganese
0.56mg
0.21mg
15%
Fiber
4.9g
2.6g
9%
Copper
0.12mg
0.049mg
8%
Vitamin B6
0.09mg
0.175mg
7%
Vitamin E
1.49mg
0.78mg
5%
Vitamin B2
0.05mg
0.117mg
5%
Carbs
17.99g
6.64g
4%
Protein
1.2g
2.82g
3%
Vitamin A
0µg
31µg
3%
Choline
18.7mg
3%
Calories
75kcal
34kcal
2%
Magnesium
29mg
21mg
2%
Potassium
375mg
316mg
2%
Iron
0.59mg
0.73mg
2%
Zinc
0.59mg
0.41mg
2%
Vitamin B1
0.09mg
0.071mg
2%
Calcium
36mg
47mg
1%
Phosphorus
71mg
66mg
1%
Sodium
10mg
33mg
1%
Selenium
1.8µg
2.5µg
1%
Vitamin B5
0.6mg
0.573mg
1%
Folate
67µg
63µg
1%
Fructose
0.68g
1%
Protein per 100 calories
1.6g
8.3g
N/A
Calories per 10 g protein
625kcal
121kcal
N/A
Weight per 100 calories
133g
294g
N/A
Fats
0.3g
0.37g
0%
Net carbs
13.09g
4.04g
N/A
Sugar
4.8g
1.7g
N/A
Vitamin B3
0.7mg
0.639mg
0%
Saturated fat
0.05g
0.039g
0%
Monounsaturated fat
0.112g
0.011g
0%
Polyunsaturated fat
0.047g
0.038g
0%
Tryptophan
0.033mg
0%
Threonine
0.088mg
0%
Isoleucine
0.079mg
0%
Leucine
0.129mg
0%
Lysine
0.135mg
0%
Methionine
0.038mg
0%
Phenylalanine
0.117mg
0%
Valine
0.125mg
0%
Histidine
0.059mg
0%
Macronutrient Comparison
Macronutrient breakdown side-by-side comparison
2
18%
80%
Protein:
1.2 g
Fats:
0.3 g
Carbs:
17.99 g
Water:
79.53 g
Other:
0.98 g
3
3%
7%
89%
Protein:
2.82 g
Fats:
0.37 g
Carbs:
6.64 g
Water:
89.3 g
Other:
0.87 g
Contains
more
Carbs Carbs
+170.9%
Contains
more
Other Other
+12.6%
Contains
more
Protein Protein
+135%
Contains
more
Fats Fats
+23.3%
Contains
more
Water Water
+12.3%
Fat Type Comparison
Fat type breakdown side-by-side comparison
2
24%
54%
22%
Saturated fat:
Sat. Fat
0.05 g
Monounsaturated fat:
Mono. Fat
0.112 g
Polyunsaturated fat:
Poly. Fat
0.047 g
1
44%
13%
43%
Saturated fat:
Sat. Fat
0.039 g
Monounsaturated fat:
Mono. Fat
0.011 g
Polyunsaturated fat:
Poly. Fat
0.038 g
Contains
more
Mono. Fat Monounsaturated fat
+918.2%
Contains
more
Poly. Fat Polyunsaturated fat
+23.7%
Contains
less
Sat. Fat Saturated fat
-22%