Broccoli Nutrition & Calories – Complete Data of All Nutrients

Summary
In summary, while broccoli is not incredibly dense in macronutrients, it is an excellent source of vitamins and minerals, including vitamin C, vitamin K, potassium, and manganese.
Broccoli is also rich in health-beneficial phytochemicals, such as glucosinolates and polyphenols. These compounds have expressed anticancer and antidiabetic qualities, among others.
Steaming is the preferred method of cooking broccoli as fewer nutrients are lost this way.
Introduction
Broccoli is often regarded as a token of a healthy lifestyle due to its nutritional value and numerous health benefits. In this article, we will discuss in detail the ingredients of broccoli and see what sets this vegetable apart from others.
Nutrition
The nutritional information and infographics in this article will focus on raw broccoli. We will discuss the nutritional alteration of broccoli due to various cooking methods below.
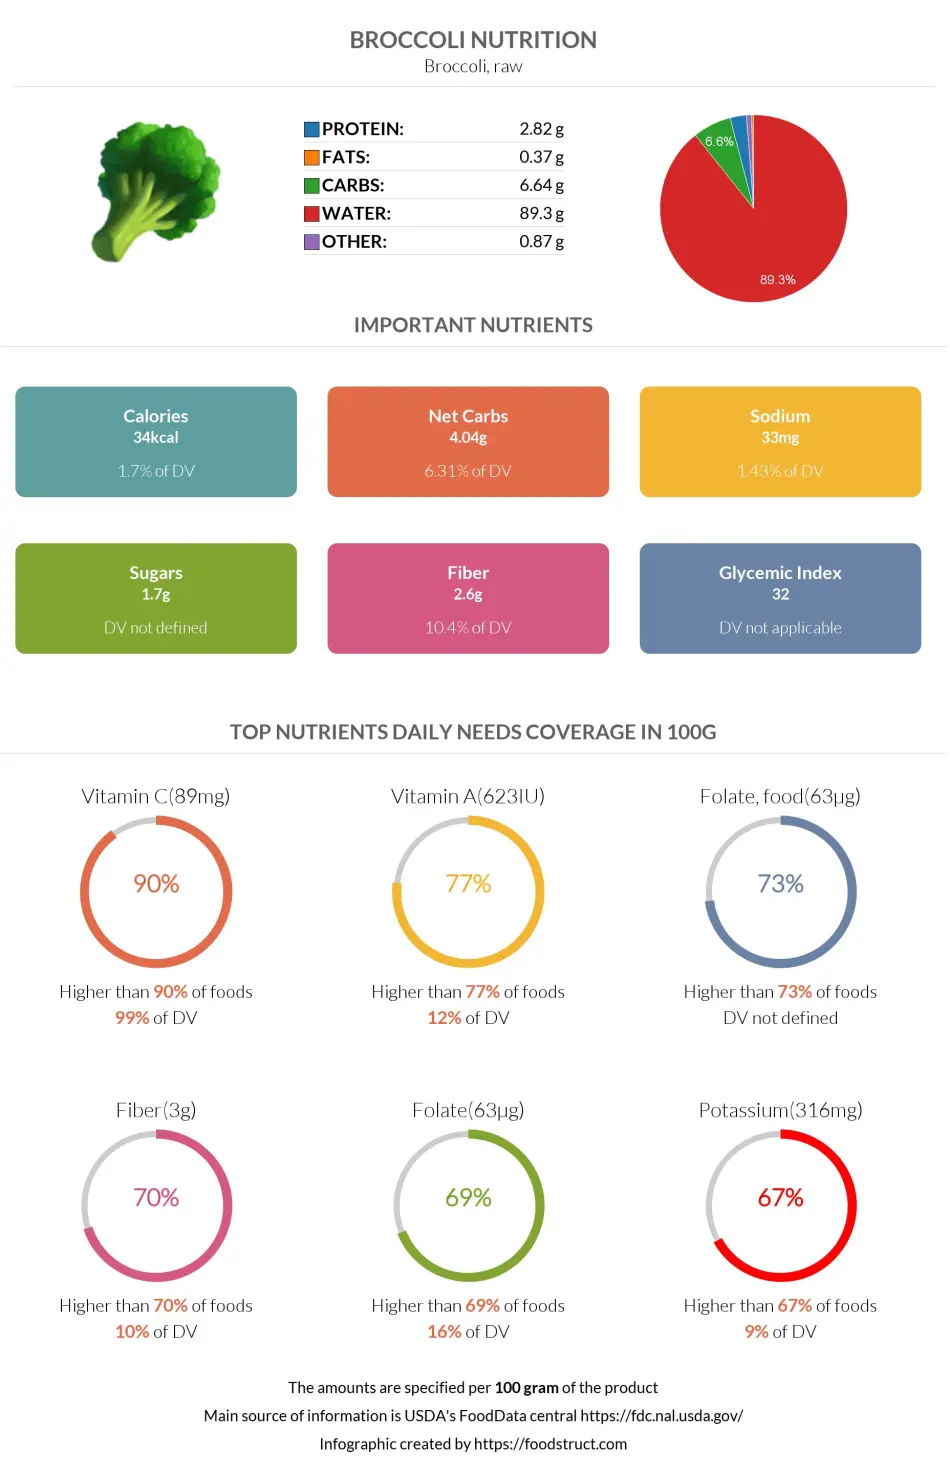
Overall, raw broccoli consists of 90% water and 10% nutrients.
One average serving size of broccoli per person weighs 148 grams.
Macronutrients chart
Calories
Broccoli is a low-calorie food, providing only 34 calories per 100g serving. Subsequently, one average serving (NLEA serving/148 grams) of broccoli contains 50 calories.
What Does 34 Calories or 100 Grams of Broccoli Look Like?
Our team measured what 100 grams of broccoli looks like to help you visualize its weight and calories. As you can see from the picture, about four pieces of broccoli made up the entire 100 grams, which meant one piece was about 25 grams or about 8-9 calories. Depending on the size of the broccoli, the weight and calories may differ for you.
Protein
Broccoli can be a great addition to a diet as a source of protein.
One average serving size of broccoli provides 4g of protein.
The protein found in broccoli contains all essential amino acids and is particularly high in tryptophan while being relatively low in leucine.
A 100g serving of broccoli covers 12% of your daily tryptophan need.
Protein quality breakdown
Carbohydrates
Broccoli contains 6.64g of carbohydrates per 100g serving, of which 39% is made up of dietary fiber (2.6g) and 61% of net carbs (4.04g).
Dietary Fiber
Broccoli contains predominantly insoluble dietary fiber. Of the 2.6g of dietary fiber found in broccoli, 91% is insoluble fiber, and only 9% is soluble fiber (1).
Fiber content ratio for Broccoli
Net Carbs
The net carb content consists of 1.7g of sugar and 2.34g of other carbohydrates.
The sugar content of broccoli includes low levels of various sugars such as fructose, glucose, lactose, maltose, and sucrose.
Carbohydrate type breakdown
Fats
Broccoli contains a negligible amount of fats, only 0.37g per 100g serving.
Like other plant-based foods, broccoli naturally contains no cholesterol.
Fat type information
Vitamins
There’s a reason why broccoli is so often associated with healthy eating. Despite the low-calorie content, broccoli is an excellent source of many vitamins.
Broccoli falls in the top 10% of foods as a source of vitamin C.
Just a 100g serving of raw broccoli can cover the daily need for vitamin C. In fact, broccoli is 1.7 times higher in this vitamin compared to oranges.
Broccoli is also in the top 23% of foods as a source of vitamin A. However, a 100g serving of this vegetable covers only 12% of the daily vitamin A needs.
A 100g serving of broccoli also covers 85% of the daily required amount of vitamin K. Keep in mind that if you are taking anticoagulant medications, such as warfarin, you should be controlling your vitamin K intake as it may interfere with the medication.
Broccoli provides adequate levels of vitamin E and B complex vitamins, especially vitamin B9 or folate.
Broccoli, however, entirely lacks vitamin D and vitamin B12.
Vitamin coverage chart
Minerals
Broccoli is also rich in minerals. It falls in the top 35% of foods as a source of potassium and calcium.
Broccoli is a good source of manganese, iron, magnesium, and phosphorus while also containing some levels of zinc, selenium, copper, and choline.
Sodium
Broccoli without added salt contains only 33mg of sodium. However, boiling broccoli with salt raises the sodium level to 262mg (2). Regardless, both forms of broccoli are low in sodium.
The daily recommended amount of sodium intake is between 3 and 5g (3).
Mineral coverage chart
Oxalates
Oxalates are compounds found in many vegetables, which may bind to calcium, increasing the risk of kidney stone formation. Broccoli contains moderate amounts of oxalates, around 20mg per 100 grams (4).
Phytochemicals
Another reason for broccoli’s appreciable health-beneficial qualities is its phytonutrient content.
Glucosinolate
The Brassicaceae family of broccoli is abundant in sulfur-containing phytochemicals called glucosinolates. Broccoli contains the highest level of glucoraphanin amongst commonly consumed vegetables of this family, including cabbage, cauliflower, and Brussels sprouts. The most prevalent glucosinolates found in broccoli are glucoraphanin, glucoiberin, and glucobrassicin (5).There is strong evidence that sulforaphane derived from glucoraphanin, as well as indole-3-carbinol derived from glucobrassicin, can be protective against cancer (6, 7).
Polyphenols
The broccoli family is also rich in polyphenols, including phenolic acids and flavonoids. Some of the major phenolics found in broccoli are chlorogenic, gentisic, ferulic, and sinapic acids (8). Some of the predominant flavanols are quercetin and kaempferol (5). All of these chemicals contain strong antioxidant qualities that can reduce cell damage.
Polyphenols have also been studied to potentially prevent diabetes, ulcers, osteoporosis, cancer, neurodegenerative and cardiovascular diseases (9).
Carotenoids
The predominant carotenoids in broccoli are β-carotene and lutein, which both have been linked with antioxidant properties, as well as improved cognitive function, reduced risk of heart disease, anticancer properties, and improvements in eye health and the progression of age-related eye diseases (5, 10). Interestingly, broccoli florets and stems contain fewer carotenoids than the leaves (11).
Seasonal Variations and Changes in Phytochemicals
According to a study by Nuñez-Gómez et al., seasonal variations play an important role in the phytochemical composition of broccoli (5).
According to the authors, the broccoli cultivated in autumn had 1.2 times more total glucosinolates, 2 times more phenolic compounds, and 2.8 times more carotenoids than broccoli cultivated in spring.
This difference was mainly attributed to temperature, sunlight exposure, and water stress.
Nutrient Comparison Among Different Parts of Broccoli
Various authors have studied how different parts of broccoli impact their phytonutrient qualities. They have divided broccoli into various parts for research purposes; some compared leaves and stalks to florets, while others compared heads to stems.
According to Mezzetti et al., broccoli’s head contains more phenolics and anthocyanins than its stem (12). Moreover, according to Liu et al., broccoli leaves are higher in vitamin E, vitamin K, total phenolic content, carotenoids, calcium, manganese, and chlorophylls, as well as in antioxidant activity when compared to florets or stems (13). On the other hand, florets had more amino acids, as well as more glucosinolates (neoglucobrassicin and glucoraphanin).
Nevertheless, all parts of broccoli are known to be full of various nutrients and phytochemicals, which positively contribute to health.
Cooked Broccoli
Research shows that cooking methods such as boiling, microwaving, and stir-frying cause broccoli to lose some of its antioxidant and nutrient content, including vitamin C, soluble proteins, and sugars. Steaming broccoli does not have the same adverse effects.
The glucosinolate phytonutrients can also be significantly reduced by these cooking methods but not by steaming (14).
Boiling broccoli can reduce its vitamin C content by up to 33%, while microwaving decreases this vitamin by 16% (14).
The boiling process drains the broccoli of its water-soluble vitamins and macronutrients; therefore, it is not an ideal preparation method. Instead, it is better to steam, briefly microwave, or simply eat it raw. Alternatively, you can use the leftover water from boiling broccoli.
Glycemic Index
The glycemic index value of broccoli has not yet been calculated due to the low sugar content; however, it is assumed to be low.
Due to their high sulforaphane content, broccoli sprouts are researched to be an excellent choice for supplementary treatment in type 2 diabetes (15).
Eating broccoli before a rice meal was shown to decrease the glycemic response of the meal while lowering insulin sensitivity (16).
Refer to our blog article to read more about the glycemic index and glycemic load values of broccoli.
Insulin Index
The insulin index demonstrates how much the given food raises the insulin level in the body after consumption.
Broccoli has an insulin index of 29 (17). This means that broccoli is considered to be a low insulin index food and can be recommended to diabetic individuals.
To see a full list of insulin index values of over 140 foods, you can visit this page.
Acidity
Broccoli has a pH value of around 6.23, making this vegetable slightly acidic. At room temperature, the pH of broccoli is a little closer to neutral - 6.54 (18).
However, when looking at the potential renal acid load or the PRAL value of broccoli, we can see that it is slightly alkaline-forming in the body.
Comparison to Similar Foods
In this section, we will compare broccoli to similar and popular vegetables. It is important to note that broccoli, broccoli rabe, and Chinese broccoli are separate vegetables.
Compared to cabbage, broccoli is slightly higher in calories, protein, and carbohydrates, including both fiber and net carbs, vitamins, and minerals.
If interested, you can find a full comparison article of “Broccoli vs. Cabbage.”
In comparison to cauliflower, broccoli is richer in calories, protein, dietary fiber, vitamins, and minerals, while cauliflower is higher in sugars. You can also find a complete “Broccoli vs. Cauliflower” comparison.
When looking at the “Broccoli vs. Chinese Broccoli” comparison, once again, broccoli is richer in calories, protein, net carbs, and dietary fiber. However, when it comes to vitamins and minerals, both of these vegetables have their advantages.
References
- https://www.ncbi.nlm.nih.gov/pmc/articles/PMC3614039/
- https://fdc.nal.usda.gov/fdc-app.html
- https://www.ncbi.nlm.nih.gov/pmc/articles/PMC8468043/
- https://www.researchgate.net/publication/280642641
- https://www.ncbi.nlm.nih.gov/pmc/articles/PMC7599945/
- https://www.sciencedirect.com/science/article/pii/B9780123756886100301
- https://pubmed.ncbi.nlm.nih.gov/12608980/
- https://www.ncbi.nlm.nih.gov/pmc/articles/PMC5956025/
- https://journals.sagepub.com/doi/abs/10.1177/1082013211433073
- https://www.sciencedirect.com/science/article/abs/pii/S0003986118301656
- https://pubmed.ncbi.nlm.nih.gov/29652847/
- https://www.mdpi.com/2076-3417/12/13/6668
- https://www.researchgate.net/publication/324513921
- https://pubmed.ncbi.nlm.nih.gov/19650196/
- https://pubmed.ncbi.nlm.nih.gov/23631497/
- https://www.mdpi.com/2072-6643/14/7/1318/htm
- https://ses.library.usyd.edu.au/handle/2123/11945
- https://www.researchgate.net/publication/318446355

Top nutrition facts for Broccoli
| Calories ⓘ Calories for selected serving | 34 kcal |
| Glycemic index ⓘ Gi values are taken from various scientific sources. GI values less than 55 are considered as low. Values above 70 are considered as high. | 32 (low) |
| Glycemic load ⓘ Glycemic Load (GL) is a metric that measures both the quality (Glycemic Index) and quantity of carbohydrates in a specific serving of food to estimate its impact on blood sugar levels. It is calculated as: (GI × Carbs in grams) / 100. | 2 (low) |
| Insulin index ⓘ The insulin index of foods demonstrates how much a food increases the insulin level in the blood, in the first two-hour period after consumption. | 29 ⓘ https://ses.library.usyd.edu.au/handle/2123/11945 – II for steamed broccoli is 29 |
| Net carbs ⓘ Net Carbs = Total Carbohydrates – Fiber – Sugar Alcohols | 4 g |
| Default serving size ⓘ Serving sizes are mostly taken from FDA's Reference Amounts Customarily Consumed (RACCs) | 1 NLEA serving (148 g) |
| Acidity (Based on PRAL) ⓘ PRAL (Potential renal acid load) is calculated using a formula. On the PRAL scale the higher the positive value, the more is the acidifying effect on the body. The lower the negative value, the higher the alkalinity of the food. 0 is neutral. | -4 (alkaline) |
| Oxalates | 20 mg ⓘ https://www.researchgate.net/publication/280642641 |
Broccoli calories (kcal)
| Calories for different serving sizes of broccoli | Calories | Weight |
|---|---|---|
| Calories in 100 grams | 34 | |
| Calories in 0.5 cup, chopped or diced | 15 | 44 g |
| Calories in 1 cup chopped | 31 | 91 g |
| Calories in 1 NLEA serving | 50 | 148 g |
| Calories in 1 stalk | 51 | 151 g |
| Calories in 1 bunch | 207 | 608 g |
| Calories for different varieties of broccoli | Calories | Weight |
|---|---|---|
| Broccoli, raw (this food) | 34 | 100 g |
| Broccoli, stalks, raw | 28 | 100 g |
Extra Nutrition facts for Broccoli
| Protein per 100 calories ⓘ Shows how many grams of protein you get from 100 calories of this food, calculated as (protein in g ÷ calories) × 100. | 8.3 g |
| Calories per 10 g protein ⓘ Shows how many calories you need to eat from this food to get 10 g of protein, calculated as (calories ÷ protein in g) × 10. | 121 kcal |
| Weight per 100 calories ⓘ Shows how many grams of this food equal 100 kcal—higher grams mean a larger portion for the same calories. | 294 g |
| Campesterol ⓘ https://fdc.nal.usda.gov/food-details/170182/nutrients | 3,5 mg ⓘ https://www.mdpi.com/2223-7747/13/10/1329 |
| Beta-sitosterol ⓘ Beta-sitosterol is a naturally occurring plant sterol (phytosterol) that is structurally similar to cholesterol. It is found in various plant-based foods and is commonly used in supplements, primarily for lowering cholesterol levels and improving symptoms of an enlarged prostate (BPH). | 13,2 mg ⓘ https://www.mdpi.com/2223-7747/13/10/1329 |
| Chlorogenic acid | 144 mg ⓘ https://www.mdpi.com/2223-7747/13/10/1329 |
| Quercetin | 30,4 mg ⓘ https://www.mdpi.com/2223-7747/13/10/1329 |
| Catechin | 59 mg ⓘ https://www.mdpi.com/2223-7747/13/10/1329 |
| Ferulic acid | 25,6 mcg ⓘ https://www.mdpi.com/2223-7747/13/10/1329 |
| Caffeic acid | 8 mcg ⓘ https://www.mdpi.com/2223-7747/13/10/1329 |
| Rutin | 103 mcg ⓘ https://www.mdpi.com/2223-7747/13/10/1329 |
| Glucoraphanin | 15.7 mg ⓘ https://www.mdpi.com/2223-7747/13/10/1329 |
| Sulforaphane | 188 mg ⓘ https://pubmed.ncbi.nlm.nih.gov/28764036/ |
| Indole-3-carbinol | 97 mg ⓘ https://pubmed.ncbi.nlm.nih.gov/28764036/ |
Broccoli Glycemic index (GI)
Broccoli Glycemic load (GL)
Mineral chart - relative view
Vitamin chart - relative view
All nutrients for Broccoli per 100g
| Nutrient | Value | DV% | In TOP % of foods | Comparison |
| Vitamin A | 31µg | 3% | 22% | |
| Calories | 34kcal | 2% | 93% |
1.4 times less than Orange
|
| Protein per 100 calories | 8.3g | N/A | 31% | |
| Protein | 2.8g | 7% | 73% |
Equal to Broccoli
|
| Calories per 10 g protein | 121kcal | N/A | 66% | |
| Weight per 100 calories | 294g | N/A | 8% | |
| Fats | 0.37g | 1% | 84% |
90 times less than Cheese
|
| Vitamin C | 89mg | 99% | 2% |
1.7 times more than Lemon
|
| Net carbs | 4g | N/A | 60% |
13.4 times less than Chocolate
|
| Carbs | 6.6g | 2% | 57% |
4.2 times less than Rice
|
| Cholesterol | 0mg | 0% | 100% |
N/A
|
| Vitamin D* | 0 IU | 0% | 100% |
N/A
|
| Vitamin D | 0µg | 0% | 100% |
N/A
|
| Magnesium | 21mg | 5% | 49% |
6.7 times less than Almonds
|
| Calcium | 47mg | 5% | 31% |
2.7 times less than Milk
|
| Potassium | 316mg | 9% | 29% |
2.1 times more than Cucumber
|
| Iron | 0.73mg | 9% | 68% |
3.6 times less than Beef broiled
|
| Sugar | 1.7g | N/A | 41% |
5.3 times less than Coca-Cola
|
| Fiber | 2.6g | 10% | 24% |
1.1 times more than Orange
|
| Copper | 0.05mg | 5% | 67% |
2.9 times less than Shiitake
|
| Zinc | 0.41mg | 4% | 66% |
15.4 times less than Beef broiled
|
| Starch | 0g | 0% | 100% |
N/A
|
| Phosphorus | 66mg | 9% | 67% |
2.8 times less than Chicken meat
|
| Sodium | 33mg | 1% | 77% |
14.8 times less than White bread
|
| Vitamin E | 0.78mg | 5% | 18% |
1.9 times less than Kiwi
|
| Manganese | 0.21mg | 9% | 27% | |
| Selenium | 2.5µg | 5% | 56% | |
| Vitamin B1 | 0.07mg | 6% | 53% |
3.7 times less than Pea raw
|
| Vitamin B2 | 0.12mg | 9% | 58% |
1.1 times less than Avocado
|
| Vitamin B3 | 0.64mg | 4% | 68% |
15 times less than Turkey meat
|
| Vitamin B5 | 0.57mg | 11% | 29% |
2 times less than Sunflower seeds
|
| Vitamin B6 | 0.18mg | 13% | 42% |
1.5 times more than Oats
|
| Vitamin B12 | 0µg | 0% | 100% |
N/A
|
| Vitamin K | 102µg | 85% | 2% |
Equal to Broccoli
|
| Folate | 63µg | 16% | 17% |
Equal to Brussels sprouts
|
| Trans fat | 0g | N/A | 100% |
N/A
|
| Saturated fat | 0.04g | 0% | 84% |
151.2 times less than Beef broiled
|
| Choline | 19mg | 3% | 31% | |
| Monounsaturated fat | 0.01g | N/A | 85% |
890.8 times less than Avocado
|
| Polyunsaturated fat | 0.04g | N/A | 85% |
1241.4 times less than Walnut
|
| Tryptophan | 0.03mg | 0% | 48% |
9.2 times less than Chicken meat
|
| Threonine | 0.09mg | 0% | 50% |
8.2 times less than Beef broiled
|
| Isoleucine | 0.08mg | 0% | 51% |
11.6 times less than Salmon raw
|
| Leucine | 0.13mg | 0% | 51% |
18.8 times less than Tuna Bluefin
|
| Lysine | 0.14mg | 0% | 48% |
3.3 times less than Tofu
|
| Methionine | 0.04mg | 0% | 49% |
2.5 times less than Quinoa
|
| Phenylalanine | 0.12mg | 0% | 49% |
5.7 times less than Egg
|
| Valine | 0.13mg | 0% | 50% |
16.2 times less than Soybean raw
|
| Histidine | 0.06mg | 0% | 49% |
12.7 times less than Turkey meat
|
| Fructose | 0.68g | 1% | 8% |
8.7 times less than Apple
|
| Caffeine | 0mg | 0% | 100% | |
| Omega-3 - EPA | 0g | N/A | 100% |
N/A
|
| Omega-3 - DHA | 0g | N/A | 100% |
N/A
|
| Omega-3 - DPA | 0g | N/A | 100% |
N/A
|
| Omega-6 - Gamma-linoleic acid | 0g | N/A | 100% | |
| Omega-6 - Eicosadienoic acid | 0g | N/A | 100% |
Check out similar food or compare with current
NUTRITION FACTS LABEL
Serving Size ______________
Health checks
Broccoli nutrition infographic
References
All the values for which the sources are not specified explicitly are taken from FDA’s Food Central. The exact link to the food presented on this page can be found below.