Peanut butter, smooth style, with salt vs. Jams, preserves, marmalades, sweetened with fruit juice — In-Depth Nutrition Comparison
Compare
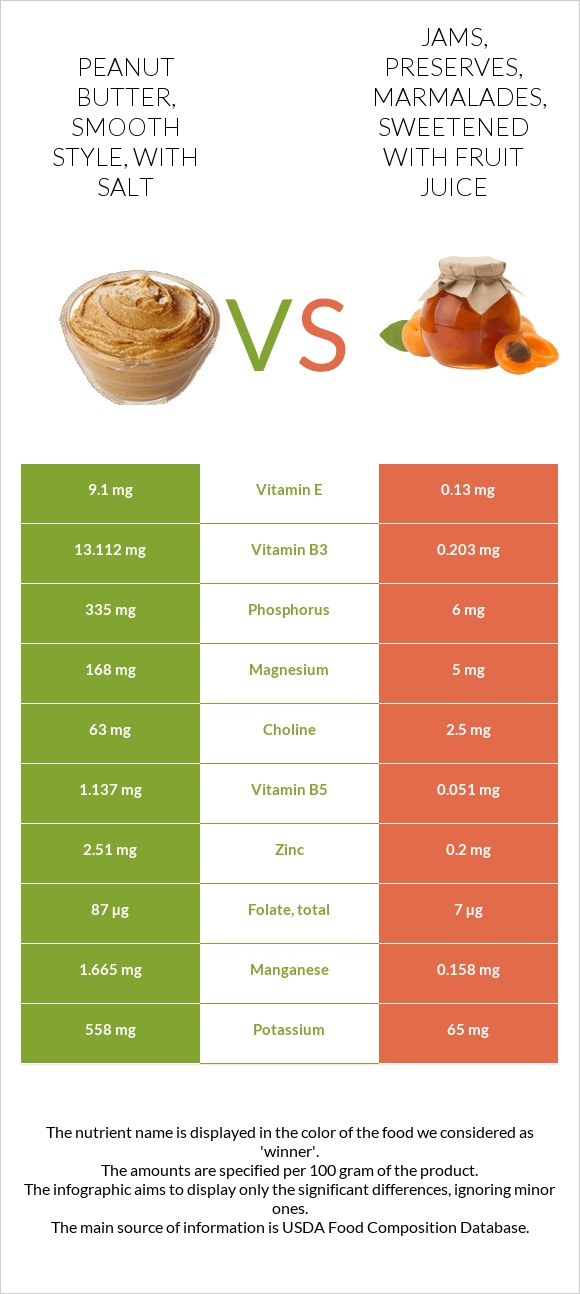
How are peanut butter, smooth style, with salt and jams, preserves, marmalades, sweetened with fruit juice different?
- Peanut butter, smooth style, with salt is higher than jams, preserves, marmalades, sweetened with fruit juice in vitamin B3, manganese, vitamin E, phosphorus, copper, magnesium, vitamin B6, vitamin B5, and zinc.
- Peanut butter, smooth style, with salt covers your daily need for vitamin B3, 81% more than jams, preserves, marmalades, sweetened with fruit juice.
Peanut butter, smooth style, with salt and Jams, preserves, marmalades, sweetened with fruit juice types were used in this article.
Infographic
Infographic link
Mineral Comparison
Mineral comparison score is based on the number of minerals by which one or the other food is richer. The "coverage" charts below show how much of the daily needs can be covered by 300 grams of the food.
| Contains more MagnesiumMagnesium | +3260% |
| Contains more CalciumCalcium | +345.5% |
| Contains more PotassiumPotassium | +758.5% |
| Contains more IronIron | +411.8% |
| Contains more CopperCopper | +1261.3% |
| Contains more ZincZinc | +1155% |
| Contains more PhosphorusPhosphorus | +5483.3% |
| Contains more ManganeseManganese | +953.8% |
| Contains more SeleniumSelenium | +412.5% |
| Contains less SodiumSodium | -100% |
Vitamin Comparison
Vitamin comparison score is based on the number of vitamins by which one or the other food is richer. The "coverage" charts below show how much of the daily needs can be covered by 300 grams of the food.
| Contains more Vitamin EVitamin E | +6900% |
| Contains more Vitamin B1Vitamin B1 | +435.7% |
| Contains more Vitamin B2Vitamin B2 | +772.7% |
| Contains more Vitamin B3Vitamin B3 | +6359.1% |
| Contains more Vitamin B5Vitamin B5 | +2129.4% |
| Contains more Vitamin B6Vitamin B6 | +3575% |
| Contains more FolateFolate | +1142.9% |
| Contains more CholineCholine | +2420% |
| Contains more Vitamin CVitamin C | +∞% |
| Contains more Vitamin AVitamin A | +∞% |
| Contains more Vitamin KVitamin K | +233.3% |
All nutrients comparison - raw data values
| Nutrient |  |
 |
DV% diff. |
| Polyunsaturated fat | 12.535g | 0g | 84% |
| Vitamin B3 | 13.112mg | 0.203mg | 81% |
| Fats | 51.36g | 0g | 79% |
| Manganese | 1.665mg | 0.158mg | 66% |
| Monounsaturated fat | 25.941g | 0g | 65% |
| Vitamin E | 9.1mg | 0.13mg | 60% |
| Saturated fat | 10.325g | 0g | 47% |
| Phosphorus | 335mg | 6mg | 47% |
| Protein | 22.21g | 0g | 44% |
| Copper | 0.422mg | 0.031mg | 43% |
| Magnesium | 168mg | 5mg | 39% |
| Vitamin B6 | 0.441mg | 0.012mg | 33% |
| Vitamin B5 | 1.137mg | 0.051mg | 22% |
| Zinc | 2.51mg | 0.2mg | 21% |
| Vitamin C | 0mg | 18.1mg | 20% |
| Folate | 87µg | 7µg | 20% |
| Calories | 598kcal | 212kcal | 19% |
| Sodium | 426mg | 0mg | 19% |
| Iron | 1.74mg | 0.34mg | 18% |
| Fiber | 5g | 0.9g | 16% |
| Potassium | 558mg | 65mg | 15% |
| Vitamin B2 | 0.192mg | 0.022mg | 13% |
| Choline | 63mg | 2.5mg | 11% |
| Carbs | 22.31g | 52.93g | 10% |
| Vitamin B1 | 0.15mg | 0.028mg | 10% |
| Selenium | 4.1µg | 0.8µg | 6% |
| Calcium | 49mg | 11mg | 4% |
| Starch | 3.56g | 1% | |
| Vitamin K | 0.3µg | 1µg | 1% |
| Net carbs | 17.31g | 52.03g | N/A |
| Sugar | 10.49g | 42g | N/A |
| Vitamin A | 0µg | 1µg | 0% |
| Trans fat | 0.075g | 0g | N/A |
| Tryptophan | 0.231mg | 0% | |
| Threonine | 0.525mg | 0% | |
| Isoleucine | 0.616mg | 0% | |
| Leucine | 1.546mg | 0% | |
| Lysine | 0.681mg | 0% | |
| Methionine | 0.265mg | 0% | |
| Phenylalanine | 1.202mg | 0% | |
| Valine | 0.782mg | 0% | |
| Histidine | 0.557mg | 0% | |
| Fructose | 0.12g | 0% | |
| Omega-3 - ALA | 0.027g | N/A | |
| Omega-3 - Eicosatrienoic acid | 0.01g | N/A | |
| Omega-6 - Gamma-linoleic acid | 0.001g | N/A | |
| Omega-6 - Eicosadienoic acid | 0.008g | N/A | |
| Omega-6 - Linoleic acid | 12.215g | N/A |
Macronutrient Comparison
Macronutrient breakdown side-by-side comparison
Protein:
22.21 g
Fats:
51.36 g
Carbs:
22.31 g
Water:
1.23 g
Other:
2.89 g
Protein:
0 g
Fats:
0 g
Carbs:
52.93 g
Water:
46.84 g
Other:
0.23 g
| Contains more ProteinProtein | +∞% |
| Contains more FatsFats | +∞% |
| Contains more OtherOther | +1156.5% |
| Contains more CarbsCarbs | +137.2% |
| Contains more WaterWater | +3708.1% |