Pie crust, deep dish, frozen, baked, made with enriched flour vs. Doughnuts — In-Depth Nutrition Comparison
Compare
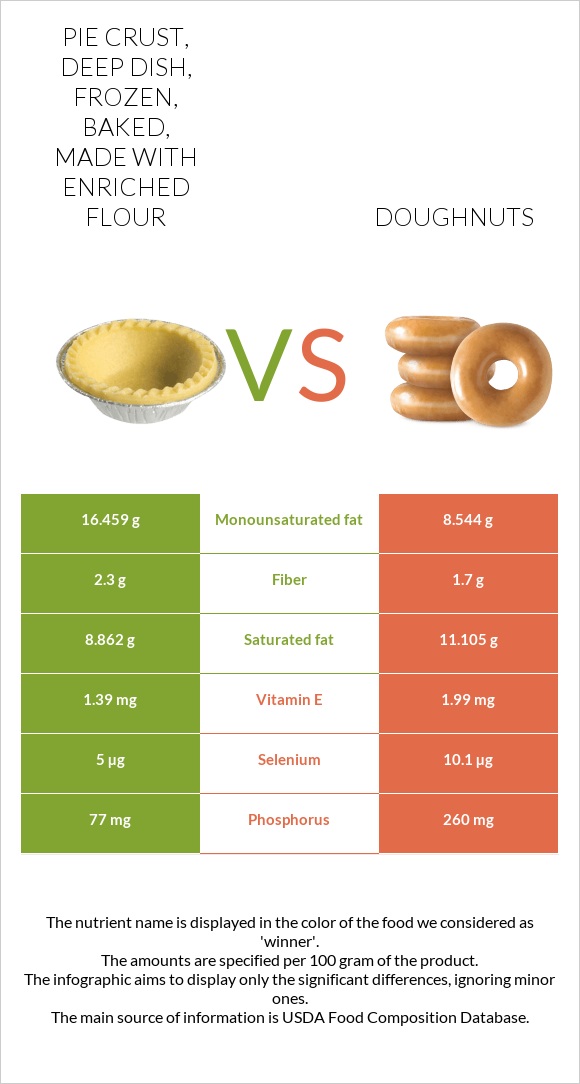
A recap on the differences between pie crust, deep dish, frozen, baked, made with enriched flour and doughnuts
- Pie crust, deep dish, frozen, baked, made with enriched flour is higher in manganese, vitamin K, and monounsaturated fat, yet doughnuts are higher in phosphorus, vitamin B2, vitamin B1, and selenium.
- Doughnuts cover your daily phosphorus needs 26% more than pie crust, deep dish, frozen, baked, made with enriched flour.
- Pie crust, deep dish, frozen, baked, made with enriched flour contains 2 times more monounsaturated fat than doughnuts. While pie crust, deep dish, frozen, baked, made with enriched flour contains 16.459g of monounsaturated fat, doughnuts contain only 8.544g.
- The amount of saturated fat in pie crust, deep dish, frozen, baked, made with enriched flour is lower.
Food varieties used in this article are Pie crust, deep dish, frozen, baked, made with enriched flour and Doughnuts, cake-type, plain (includes unsugared, old-fashioned).
Infographic
Infographic link
Mineral Comparison
Mineral comparison score is based on the number of minerals by which one or the other food is richer. The "coverage" charts below show how much of the daily needs can be covered by 300 grams of the food.
| Contains less SodiumSodium | -17.6% |
| Contains more ManganeseManganese | +60.1% |
| Contains more CalciumCalcium | +73.9% |
| Contains more PotassiumPotassium | +30.1% |
| Contains more PhosphorusPhosphorus | +237.7% |
| Contains more SeleniumSelenium | +102% |
Vitamin Comparison
Vitamin comparison score is based on the number of vitamins by which one or the other food is richer. The "coverage" charts below show how much of the daily needs can be covered by 300 grams of the food.
| Contains more Vitamin KVitamin K | +70.4% |
| Contains more Vitamin EVitamin E | +43.2% |
| Contains more Vitamin B1Vitamin B1 | +48.3% |
| Contains more Vitamin B2Vitamin B2 | +131.5% |
| Contains more Vitamin B6Vitamin B6 | +25% |
| Contains more Vitamin B12Vitamin B12 | +∞% |
All nutrients comparison - raw data values
| Nutrient |  |
 |
DV% diff. |
| Phosphorus | 77mg | 260mg | 26% |
| Monounsaturated fat | 16.459g | 8.544g | 20% |
| Vitamin B2 | 0.13mg | 0.301mg | 13% |
| Fats | 31.84g | 24.93g | 11% |
| Vitamin B1 | 0.263mg | 0.39mg | 11% |
| Saturated fat | 8.862g | 11.105g | 10% |
| Manganese | 0.533mg | 0.333mg | 9% |
| Selenium | 5µg | 10.1µg | 9% |
| Starch | 45.67g | 25.91g | 8% |
| Choline | 37.3mg | 7% | |
| Vitamin K | 16.7µg | 9.8µg | 6% |
| Calories | 521kcal | 434kcal | 4% |
| Sodium | 393mg | 477mg | 4% |
| Vitamin E | 1.39mg | 1.99mg | 4% |
| Cholesterol | 10mg | 3% | |
| Vitamin B12 | 0µg | 0.06µg | 3% |
| Protein | 6.1g | 5.31g | 2% |
| Carbs | 52.47g | 47.06g | 2% |
| Calcium | 23mg | 40mg | 2% |
| Fiber | 2.3g | 1.7g | 2% |
| Potassium | 103mg | 134mg | 1% |
| Iron | 2.47mg | 2.53mg | 1% |
| Vitamin B5 | 0.403mg | 0.377mg | 1% |
| Vitamin B6 | 0.04mg | 0.05mg | 1% |
| Folate | 94µg | 92µg | 1% |
| Protein per 100 calories | 1.2g | 1.2g | N/A |
| Calories per 10 g protein | 854kcal | 817kcal | N/A |
| Weight per 100 calories | 19g | 23g | N/A |
| Unsaturated / Saturated Fat ratio | 2.3 | 1.1 | N/A |
| Net carbs | 50.17g | 45.36g | N/A |
| Magnesium | 17mg | 17mg | 0% |
| Sugar | 18.15g | N/A | |
| Copper | 0.089mg | 0.09mg | 0% |
| Zinc | 0.52mg | 0.5mg | 0% |
| Vitamin A | 4µg | 0% | |
| Vitamin B3 | 2.867mg | 2.91mg | 0% |
| Polyunsaturated fat | 3.918g | 3.915g | 0% |
| Tryptophan | 0.057mg | 0% | |
| Threonine | 0.129mg | 0% | |
| Isoleucine | 0.223mg | 0% | |
| Leucine | 0.422mg | 0% | |
| Lysine | 0.112mg | 0% | |
| Methionine | 0.093mg | 0% | |
| Phenylalanine | 0.276mg | 0% | |
| Valine | 0.28mg | 0% | |
| Histidine | 0.106mg | 0% | |
| Omega-3 - DHA | 0.001g | N/A | |
| Omega-3 - ALA | 0.13g | 0.239g | N/A |
| Omega-3 - Eicosatrienoic acid | 0.001g | N/A | |
| Omega-6 - Gamma-linoleic acid | 0g | 0.017g | N/A |
| Omega-6 - Eicosadienoic acid | 0.062g | 0.006g | N/A |
| Omega-6 - Linoleic acid | 3.573g | N/A |
Macronutrient Comparison
Macronutrient breakdown side-by-side comparison
Protein:
6.1 g
Fats:
31.84 g
Carbs:
52.47 g
Water:
8.26 g
Other:
1.33 g
Protein:
5.31 g
Fats:
24.93 g
Carbs:
47.06 g
Water:
20.82 g
Other:
1.88 g
| Contains more ProteinProtein | +14.9% |
| Contains more FatsFats | +27.7% |
| Contains more CarbsCarbs | +11.5% |
| Contains more WaterWater | +152.1% |
| Contains more OtherOther | +41.4% |
Fat Type Comparison
Fat type breakdown side-by-side comparison
Saturated fat:
Sat. Fat
8.862 g
Monounsaturated fat:
Mono. Fat
16.459 g
Polyunsaturated fat:
Poly. Fat
3.918 g
Saturated fat:
Sat. Fat
11.105 g
Monounsaturated fat:
Mono. Fat
8.544 g
Polyunsaturated fat:
Poly. Fat
3.915 g
| Contains less Sat. FatSaturated fat | -20.2% |
| Contains more Mono. FatMonounsaturated fat | +92.6% |
~equal in
Polyunsaturated fat
~3.915g
Carbohydrate type comparison
Carbohydrate type breakdown side-by-side comparison
Starch:
45.67 g
Sucrose:
0 g
Glucose:
0 g
Fructose:
0 g
Lactose:
0 g
Maltose:
0 g
Galactose:
0 g
Starch:
25.91 g
Sucrose:
16.02 g
Glucose:
0.67 g
Fructose:
0 g
Lactose:
0.93 g
Maltose:
0.54 g
Galactose:
0 g
| Contains more StarchStarch | +76.3% |
| Contains more SucroseSucrose | +∞% |
| Contains more GlucoseGlucose | +∞% |
| Contains more LactoseLactose | +∞% |
| Contains more MaltoseMaltose | +∞% |
~equal in
Fructose
~0g
~equal in
Galactose
~0g