Pita bread vs. Pita — In-Depth Nutrition Comparison
Compare
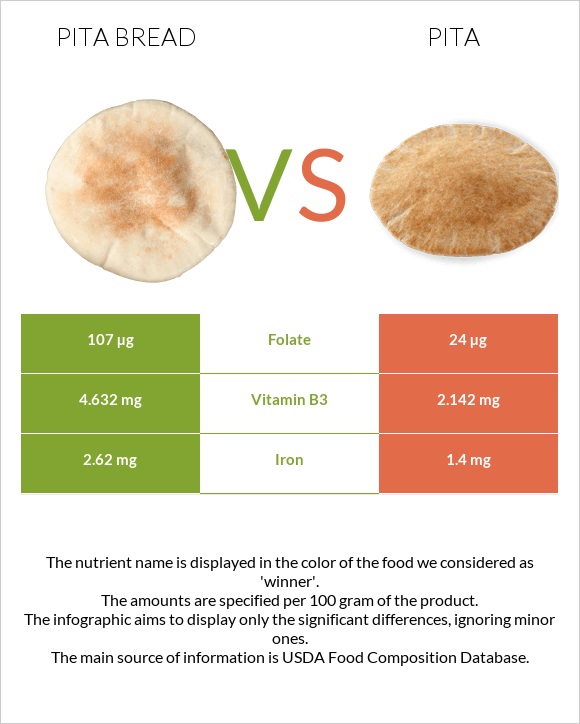
The main differences between pita bread and pita
- Pita contains less vitamin B1, folate, vitamin B2, vitamin B3, and iron than pita bread.
- Daily need coverage for vitamin B1 for pita bread is 28% higher.
- Pita has 4 times less folate than pita bread. Pita bread has 107µg of folate, while pita has 24µg.
Food types used in this article are Bread, pita, white, enriched and Bread, pita, white, unenriched.
Infographic
Infographic link
Mineral Comparison
Mineral comparison score is based on the number of minerals by which one or the other food is richer. The "coverage" charts below show how much of the daily needs can be covered by 300 grams of the food.
| Contains more IronIron | +87.1% |
| Contains more SeleniumSelenium | +∞% |
Vitamin Comparison
Vitamin comparison score is based on the number of vitamins by which one or the other food is richer. The "coverage" charts below show how much of the daily needs can be covered by 300 grams of the food.
| Contains more Vitamin EVitamin E | +∞% |
| Contains more Vitamin B1Vitamin B1 | +124.3% |
| Contains more Vitamin B2Vitamin B2 | +237.1% |
| Contains more Vitamin B3Vitamin B3 | +116.2% |
| Contains more Vitamin KVitamin K | +∞% |
| Contains more FolateFolate | +345.8% |
| Contains more CholineCholine | +∞% |
All nutrients comparison - raw data values
| Nutrient |  |
 |
DV% diff. |
| Selenium | 27.1µg | 49% | |
| Vitamin B1 | 0.599mg | 0.267mg | 28% |
| Folate | 107µg | 24µg | 21% |
| Vitamin B2 | 0.327mg | 0.097mg | 18% |
| Vitamin B3 | 4.632mg | 2.142mg | 16% |
| Iron | 2.62mg | 1.4mg | 15% |
| Choline | 14.6mg | 3% | |
| Vitamin E | 0.3mg | 2% | |
| Calories | 275kcal | 275kcal | 0% |
| Protein | 9.1g | 9.1g | 0% |
| Fats | 1.2g | 1.2g | 0% |
| Carbs | 55.7g | 55.7g | 0% |
| Net carbs | 53.5g | 53.5g | N/A |
| Magnesium | 26mg | 26mg | 0% |
| Calcium | 86mg | 86mg | 0% |
| Potassium | 120mg | 120mg | 0% |
| Sugar | 1.3g | N/A | |
| Fiber | 2.2g | 2.2g | 0% |
| Copper | 0.168mg | 0.168mg | 0% |
| Zinc | 0.84mg | 0.84mg | 0% |
| Phosphorus | 97mg | 97mg | 0% |
| Sodium | 536mg | 536mg | 0% |
| Manganese | 0.481mg | 0.481mg | 0% |
| Vitamin B5 | 0.397mg | 0.397mg | 0% |
| Vitamin B6 | 0.034mg | 0.034mg | 0% |
| Vitamin K | 0.2µg | 0% | |
| Saturated fat | 0.166g | 0.166g | 0% |
| Monounsaturated fat | 0.105g | 0.105g | 0% |
| Polyunsaturated fat | 0.535g | 0.535g | 0% |
| Tryptophan | 0.105mg | 0.105mg | 0% |
| Threonine | 0.257mg | 0.257mg | 0% |
| Isoleucine | 0.349mg | 0.349mg | 0% |
| Leucine | 0.634mg | 0.634mg | 0% |
| Lysine | 0.219mg | 0.219mg | 0% |
| Methionine | 0.16mg | 0.16mg | 0% |
| Phenylalanine | 0.446mg | 0.446mg | 0% |
| Valine | 0.394mg | 0.394mg | 0% |
| Histidine | 0.195mg | 0.195mg | 0% |
Macronutrient Comparison
Macronutrient breakdown side-by-side comparison
Protein:
9.1 g
Fats:
1.2 g
Carbs:
55.7 g
Water:
32.1 g
Other:
1.9 g
Protein:
9.1 g
Fats:
1.2 g
Carbs:
55.7 g
Water:
32.1 g
Other:
1.9 g
~equal in
Protein
~9.1g
~equal in
Fats
~1.2g
~equal in
Carbs
~55.7g
~equal in
Water
~32.1g
~equal in
Other
~1.9g
Fat Type Comparison
Fat type breakdown side-by-side comparison
Saturated fat:
Sat. Fat
0.166 g
Monounsaturated fat:
Mono. Fat
0.105 g
Polyunsaturated fat:
Poly. Fat
0.535 g
Saturated fat:
Sat. Fat
0.166 g
Monounsaturated fat:
Mono. Fat
0.105 g
Polyunsaturated fat:
Poly. Fat
0.535 g
~equal in
Saturated fat
~0.166g
~equal in
Monounsaturated fat
~0.105g
~equal in
Polyunsaturated fat
~0.535g