Pumpkin, canned, without salt vs. Rice — In-Depth Nutrition Comparison
Compare
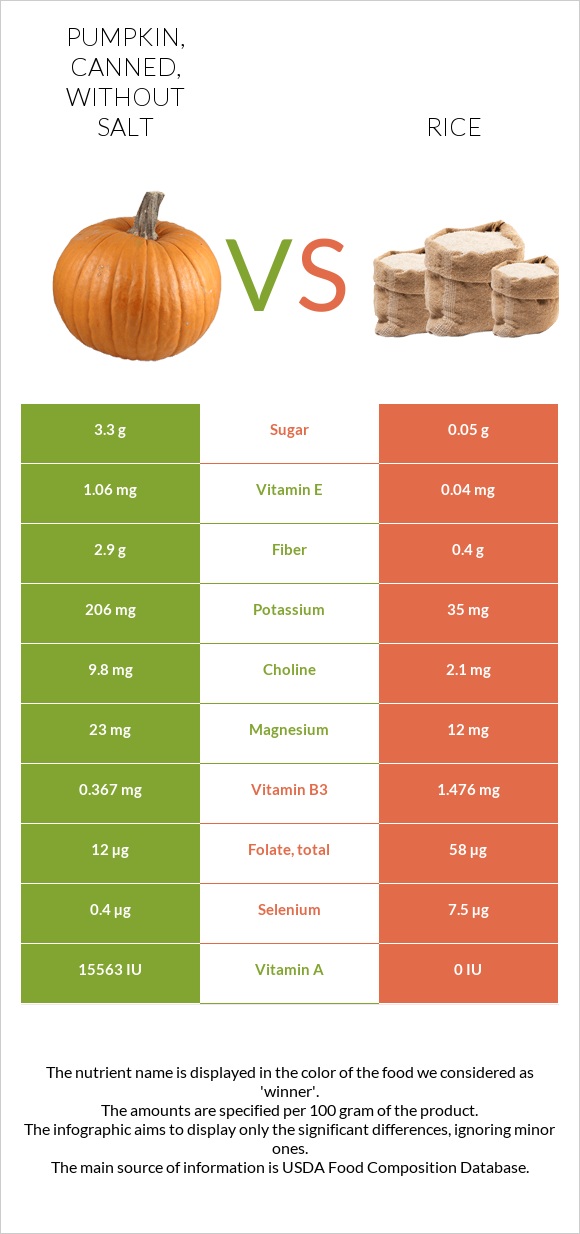
How are pumpkin, canned, without salt and rice different?
- Pumpkin, canned, without salt is higher in vitamin A, vitamin K, fiber, vitamin E, and potassium; however, rice is richer in manganese, selenium, vitamin B1, folate, and vitamin B3.
- Daily need coverage for vitamin A for pumpkin, canned, without salt is 311% higher.
Pumpkin, canned, without salt and Rice, white, long-grain, regular, enriched, cooked are the varieties used in this article.
Infographic
Infographic link
Mineral Comparison
Mineral comparison score is based on the number of minerals by which one or the other food is richer. The "coverage" charts below show how much of the daily needs can be covered by 300 grams of the food.
| Contains more MagnesiumMagnesium | +91.7% |
| Contains more CalciumCalcium | +160% |
| Contains more PotassiumPotassium | +488.6% |
| Contains more IronIron | +15.8% |
| Contains more CopperCopper | +55.1% |
| Contains more ZincZinc | +188.2% |
| Contains more PhosphorusPhosphorus | +22.9% |
| Contains less SodiumSodium | -80% |
| Contains more ManganeseManganese | +216.8% |
| Contains more SeleniumSelenium | +1775% |
Vitamin Comparison
Vitamin comparison score is based on the number of vitamins by which one or the other food is richer. The "coverage" charts below show how much of the daily needs can be covered by 300 grams of the food.
| Contains more Vitamin CVitamin C | +∞% |
| Contains more Vitamin AVitamin A | +∞% |
| Contains more Vitamin EVitamin E | +2550% |
| Contains more Vitamin B2Vitamin B2 | +315.4% |
| Contains more Vitamin KVitamin K | +∞% |
| Contains more CholineCholine | +366.7% |
| Contains more Vitamin B1Vitamin B1 | +579.2% |
| Contains more Vitamin B3Vitamin B3 | +302.2% |
| Contains more Vitamin B6Vitamin B6 | +66.1% |
| Contains more FolateFolate | +383.3% |
Macronutrient Comparison
Macronutrient breakdown side-by-side comparison
Protein:
1.1 g
Fats:
0.28 g
Carbs:
8.09 g
Water:
89.97 g
Other:
0.56 g
Protein:
2.69 g
Fats:
0.28 g
Carbs:
28.17 g
Water:
68.44 g
Other:
0.42 g
| Contains more WaterWater | +31.5% |
| Contains more OtherOther | +33.3% |
| Contains more ProteinProtein | +144.5% |
| Contains more CarbsCarbs | +248.2% |
~equal in
Fats
~0.28g
Fat Type Comparison
Fat type breakdown side-by-side comparison
Saturated fat:
Sat. Fat
0.146 g
Monounsaturated fat:
Mono. Fat
0.037 g
Polyunsaturated fat:
Poly. Fat
0.015 g
Saturated fat:
Sat. Fat
0.077 g
Monounsaturated fat:
Mono. Fat
0.088 g
Polyunsaturated fat:
Poly. Fat
0.076 g
| Contains less Sat. FatSaturated fat | -47.3% |
| Contains more Mono. FatMonounsaturated fat | +137.8% |
| Contains more Poly. FatPolyunsaturated fat | +406.7% |
Comparison summary table
Pay attention to the rightmost column. It displays the amounts side by side, giving a clearer understanding of the difference.
 |
 |
||
| Lower in Sugar |
|
||
| Lower in Sodium |
|
||
| Lower in Saturated fat |
|
||
| Lower in Glycemic Index |
|
||
| Lower in price |
|
||
| Lower in Cholesterol | Equal | ||
| Rich in minerals | Equal | ||
| Rich in vitamins | Equal | ||
All nutrients comparison - raw data values
| Nutrient | |
|
DV% diff. |
| Vitamin A | 778µg | 0µg | 86% |
| Manganese | 0.149mg | 0.472mg | 14% |
| Selenium | 0.4µg | 7.5µg | 13% |
| Vitamin K | 16µg | 0µg | 13% |
| Vitamin B1 | 0.024mg | 0.163mg | 12% |
| Folate | 12µg | 58µg | 12% |
| Fiber | 2.9g | 0.4g | 10% |
| Vitamin B3 | 0.367mg | 1.476mg | 7% |
| Carbs | 8.09g | 28.17g | 7% |
| Vitamin E | 1.06mg | 0.04mg | 7% |
| Calories | 34kcal | 130kcal | 5% |
| Potassium | 206mg | 35mg | 5% |
| Vitamin C | 4.2mg | 0mg | 5% |
| Copper | 0.107mg | 0.069mg | 4% |
| Zinc | 0.17mg | 0.49mg | 3% |
| Magnesium | 23mg | 12mg | 3% |
| Protein | 1.1g | 2.69g | 3% |
| Vitamin B2 | 0.054mg | 0.013mg | 3% |
| Vitamin B6 | 0.056mg | 0.093mg | 3% |
| Iron | 1.39mg | 1.2mg | 2% |
| Calcium | 26mg | 10mg | 2% |
| Phosphorus | 35mg | 43mg | 1% |
| Choline | 9.8mg | 2.1mg | 1% |
| Fats | 0.28g | 0.28g | 0% |
| Net carbs | 5.19g | 27.77g | N/A |
| Sugar | 3.3g | 0.05g | N/A |
| Sodium | 5mg | 1mg | 0% |
| Vitamin B5 | 0.4mg | 0.39mg | 0% |
| Saturated fat | 0.146g | 0.077g | 0% |
| Monounsaturated fat | 0.037g | 0.088g | 0% |
| Polyunsaturated fat | 0.015g | 0.076g | 0% |
| Tryptophan | 0.013mg | 0.031mg | 0% |
| Threonine | 0.032mg | 0.096mg | 0% |
| Isoleucine | 0.034mg | 0.116mg | 0% |
| Leucine | 0.051mg | 0.222mg | 0% |
| Lysine | 0.06mg | 0.097mg | 0% |
| Methionine | 0.012mg | 0.063mg | 0% |
| Phenylalanine | 0.035mg | 0.144mg | 0% |
| Valine | 0.038mg | 0.164mg | 0% |
| Histidine | 0.017mg | 0.063mg | 0% |
Which food is preferable for your diet?
is better in case of low diet
|
|
|
| Low Calories diet |
|
|
| Low Fats diet | Equal | |
| Low Carbs diet |
|
|
| Low Glycemic Index diet |
|
|
Vitamins & Minerals Daily Need Coverage Score
The summary scores indicate the extent to which this food can fulfill your daily vitamin and mineral requirements if you consume 3 servings, consisting of 100 grams of each (an approximation of 3 serving sizes).
Vitamins Daily Need Coverage Score
32%
12%
Minerals Daily Need Coverage Score
17%
22%
Comparison summary
Which food is lower in Sugar?
Rice is lower in Sugar (difference - 3.25g)
Which food contains less Sodium?
Rice contains less Sodium (difference - 4mg)
Which food is lower in Saturated fat?
Rice is lower in Saturated fat (difference - 0.069g)
Which food is lower in glycemic index?
Pumpkin, canned, without salt is lower in glycemic index (difference - 60)
Which food is cheaper?
Pumpkin, canned, without salt is cheaper (difference - $1)
Which food contains less Cholesterol?
?
The foods are relatively equal in Cholesterol (0 mg)
Which food is richer in minerals?
?
It cannot be stated which food is richer in vitamins. See the charts below for detailed information. See the charts below for detailed information. See the charts below for detailed information.
Which food is richer in vitamins?
?
It cannot be stated which food is richer in vitamins. See the charts below for detailed information. See the charts below for detailed information. See the charts below for detailed information.