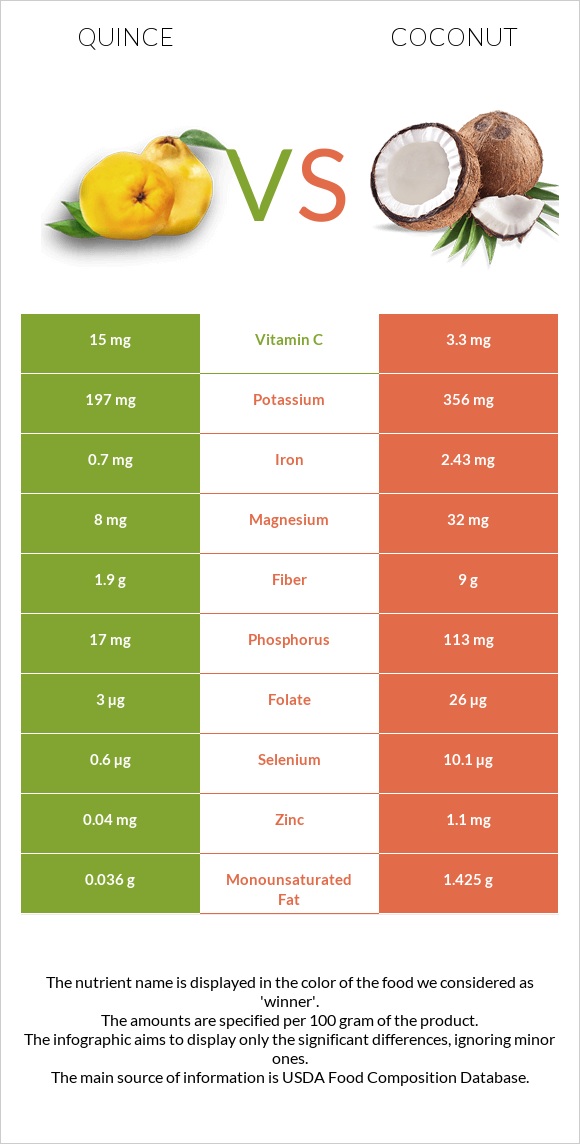
Significant differences between quince and coconut Quince has more vitamin C; however, coconut is richer in copper, fiber, iron, selenium, phosphorus, zinc, folate, and magnesium. Coconut covers your daily saturated fat needs 148% more than quince. Coconut has 5 times less vitamin C than quince. Quince has 15mg of vitamin C, while coconut has 3.3mg. Quince contains less saturated fat. Coconut has a higher glycemic index. The glycemic index of coconut is 59, while the glycemic index of quince is 35. Specific food types used in this comparison are Quinces, raw and Nuts, coconut meat, raw .
Infographic
Mineral Comparison
Mineral comparison score is based on the number of minerals by which one or the other food is richer. The "coverage" charts below show how much of the daily needs can be covered by 300 grams of the food.
1
100 g
300 g
1 fruit without refuse - 92g
Magnesium
Magnesium
Calcium
Calcium
Potassium
Potassium
Iron
Iron
Copper
Copper
Zinc
Zinc
Phosphorus
Phosphorus
Sodium
Sodium
Manganese
Manganese
Selenium
Selenium
5.7%
3.3%
17%
26%
43%
1.1%
7.3%
0.52%
0%
3.3%
9
100 g
300 g
1 piece (2" x 2" x 1/2") - 45g 1 cup, shredded - 80g 1 medium - 397g
Magnesium
Magnesium
Calcium
Calcium
Potassium
Potassium
Iron
Iron
Copper
Copper
Zinc
Zinc
Phosphorus
Phosphorus
Sodium
Sodium
Manganese
Manganese
Selenium
Selenium
23%
4.2%
31%
91%
145%
30%
48%
2.6%
196%
55%
Vitamin Comparison
Vitamin comparison score is based on the number of vitamins by which one or the other food is richer. The "coverage" charts below show how much of the daily needs can be covered by 300 grams of the food.
3
100 g
300 g
1 fruit without refuse - 92g
Vitamin C
Vit. C
Vitamin D
Vit. D
Vitamin A
Vit. A
Vitamin E
Vit. E
Vitamin B1
Vit. B1
Vitamin B2
Vit. B2
Vitamin B3
Vit. B3
Vitamin B5
Vit. B5
Vitamin B6
Vit. B6
Vitamin B12
Vit. B12
Vitamin K
Vit. K
Folate
Folate
50%
0%
0.67%
0%
5%
6.9%
3.8%
4.9%
9.2%
0%
0%
2.3%
7
100 g
300 g
1 piece (2" x 2" x 1/2") - 45g 1 cup, shredded - 80g 1 medium - 397g
Vitamin C
Vit. C
Vitamin D
Vit. D
Vitamin A
Vit. A
Vitamin E
Vit. E
Vitamin B1
Vit. B1
Vitamin B2
Vit. B2
Vitamin B3
Vit. B3
Vitamin B5
Vit. B5
Vitamin B6
Vit. B6
Vitamin B12
Vit. B12
Vitamin K
Vit. K
Folate
Folate
11%
0%
0%
4.8%
17%
4.6%
10%
18%
12%
0%
0.5%
20%
All nutrients comparison - raw data values
Nutrient
DV% diff.
Saturated fat
0.01g
29.698g
135%
Manganese
1.5mg
65%
Fats
0.1g
33.49g
51%
Copper
0.13mg
0.435mg
34%
Fiber
1.9g
9g
28%
Iron
0.7mg
2.43mg
22%
Selenium
0.6µg
10.1µg
17%
Calories
57kcal
354kcal
15%
Phosphorus
17mg
113mg
14%
Vitamin C
15mg
3.3mg
13%
Zinc
0.04mg
1.1mg
10%
Protein
0.4g
3.33g
6%
Magnesium
8mg
32mg
6%
Folate
3µg
26µg
6%
Potassium
197mg
356mg
5%
Vitamin B1
0.02mg
0.066mg
4%
Vitamin B5
0.081mg
0.3mg
4%
Monounsaturated fat
0.036g
1.425g
3%
Vitamin E
0.24mg
2%
Vitamin B3
0.2mg
0.54mg
2%
Choline
12.1mg
2%
Polyunsaturated fat
0.05g
0.366g
2%
Sodium
4mg
20mg
1%
Vitamin B2
0.03mg
0.02mg
1%
Vitamin B6
0.04mg
0.054mg
1%
Weight per 100 calories
175g
28g
N/A
Unsaturated / Saturated Fat ratio
8.6
0.06
N/A
Net carbs
13.4g
6.23g
N/A
Carbs
15.3g
15.23g
0%
Calcium
11mg
14mg
0%
Sugar
6.23g
N/A
Vitamin A
2µg
0µg
0%
Vitamin K
0.2µg
0%
Tryptophan
0.039mg
0%
Threonine
0.121mg
0%
Isoleucine
0.131mg
0%
Leucine
0.247mg
0%
Lysine
0.147mg
0%
Methionine
0.062mg
0%
Phenylalanine
0.169mg
0%
Valine
0.202mg
0%
Histidine
0.077mg
0%
Macronutrient Comparison
Macronutrient breakdown side-by-side comparison
2
15%
84%
Protein:
0.4 g
Fats:
0.1 g
Carbs:
15.3 g
Water:
83.8 g
Other:
0.4 g
3
3%
33%
15%
47%
Protein:
3.33 g
Fats:
33.49 g
Carbs:
15.23 g
Water:
46.99 g
Other:
0.96 g
Contains
more
Water Water
+78.3%
Contains
more
Protein Protein
+732.5%
Contains
more
Fats Fats
+33390%
Contains
more
Other Other
+140%
Fat Type Comparison
Fat type breakdown side-by-side comparison
1
10%
38%
52%
Saturated fat:
Sat. Fat
0.01 g
Monounsaturated fat:
Mono. Fat
0.036 g
Polyunsaturated fat:
Poly. Fat
0.05 g
2
94%
5%
Saturated fat:
Sat. Fat
29.698 g
Monounsaturated fat:
Mono. Fat
1.425 g
Polyunsaturated fat:
Poly. Fat
0.366 g
Contains
less
Sat. Fat Saturated fat
-100%
Contains
more
Mono. Fat Monounsaturated fat
+3858.3%
Contains
more
Poly. Fat Polyunsaturated fat
+632%