Rabbit Meat vs. Pork Meat — Health Impact and Nutrition Comparison


Summary
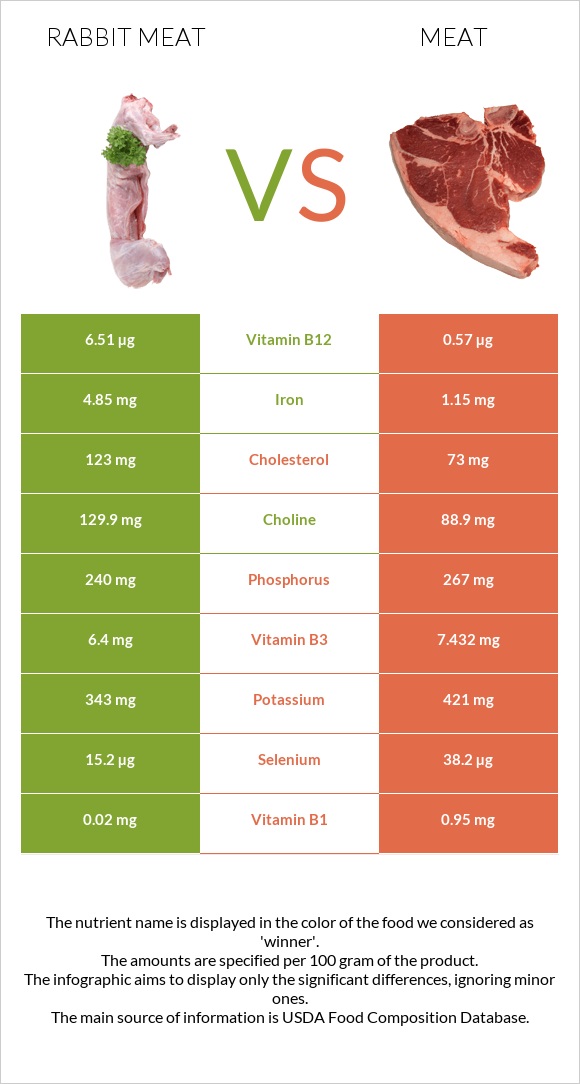
Rabbit meat has more iron, choline, calcium, copper, magnesium, folate, protein, polyunsaturated fats, and vitamins B12 and E. On the other hand, pork meat provides more monounsaturated fats, potassium, phosphorus, selenium, zinc, and vitamins B1, B2, B3, B5, B6, and D. Moreover, rabbit meat has less sodium and saturated fats, whereas pork provides fewer calories and cholesterol.
Table of contents
Introduction
Rabbit meat is game meat. Rabbit meat is white meat, similar to poultry because it is lean and has a lighter color. In contrast, pork is red meat due to its higher myoglobin content, which gives it a darker hue than white meats such as chicken or rabbit. Pork, veal, lamb, and beef are livestock (1).
Nutrition
This part of the article will compare the nutritional information of rabbit meat and pork meat.
Macronutrients and Calories
Rabbit meat and pork meat have similar nutritional densities, rabbit meat being a little denser. Rabbit meat contains 61% water, whereas pork meat contains 70% water.
Macronutrient Comparison
Contains
more
ProteinProtein
+26.2%
Contains
more
OtherOther
+141.4%
Contains
more
WaterWater
+13.2%
Calories
Compared to rabbit meat, pork meat provides fewer calories per hundred grams. A 100g rabbit meat has 173 calories, whereas pork meat provides 143 calories. The serving size for rabbit and pork meat is 3oz or 85g. One serving of rabbit meat has 147 kcal, whereas one serving of pork meat provides 122 kcal.
Protein
Compared to pork meat, rabbit provides more protein. A 100 g serving of rabbit and pork meat have 33g and 26g of protein, respectively. Both contain all essential amino acids, but rabbit meat is higher in all of them except for histidine.
Fats
Rabbit and pork are equal in fat content. A hundred grams of each meat provides 3.51 grams of fat. However, pork meat has more saturated and monounsaturated fats, whereas rabbit meat provides more polyunsaturated fats.
Fat Type Comparison
Contains
less
Sat. FatSaturated fat
-12.4%
Contains
more
Poly. FatPolyunsaturated fat
+34.4%
Contains
more
Mono. FatMonounsaturated fat
+40.4%
Carbohydrates
Rabbit meat and pork meat do not contain carbs.
Cholesterol
Rabbit meat has more cholesterol than pork meat. A hundred grams of rabbit meat has 123mg of cholesterol, whereas pork meat has 73mg.
Vitamins
Rabbit meat and pork meat are not good sources of vitamins. Rabbit meat has over 11.5 times more vitamin B12. In a 100g serving, rabbit and pork have 6.51µg and 0.57µg of vitamin B12, respectively. It has also more vitamin E, K, and folate. Pork meat provides more vitamins B1 (thiamine), B2 (riboflavin), B3 (niacin), B5, B6, and D.
Vitamin Comparison
Contains
more
Vitamin EVitamin E
+412.5%
Contains
more
Vitamin B12Vitamin B12
+1042.1%
Contains
more
Vitamin KVitamin K
+∞%
Contains
more
FolateFolate
+∞%
Contains
more
Vitamin DVitamin D
+∞%
Contains
more
Vitamin B1Vitamin B1
+4650%
Contains
more
Vitamin B2Vitamin B2
+452.9%
Contains
more
Vitamin B3Vitamin B3
+16.1%
Contains
more
Vitamin B6Vitamin B6
+117.4%
Minerals
Rabbit meat has over four times more iron, three times more calcium, and 1.5 times more choline, whereas pork meat has over 2.5 times more selenium. Rabbit also provides more magnesium and copper, whereas pork is high in phosphorus, potassium, zinc, and sodium.
qMineral Comparison
Contains
more
CalciumCalcium
+200%
Contains
more
IronIron
+321.7%
Contains
more
CopperCopper
+58.6%
Contains
less
SodiumSodium
-21.1%
Contains
more
PotassiumPotassium
+22.7%
Contains
more
PhosphorusPhosphorus
+11.3%
Contains
more
SeleniumSelenium
+151.3%
Glycemic Index
Rabbit meat and pork meat both have a glycemic index of 0. Foods that naturally contain no carbs do not stimulate glucose absorption and, therefore, do not have a glycemic index.
Acidity
The PRAL value indicates how a food can break down into acids or bases in the body. Rabbit meat has a PRAL level of 16.8, while pork meat has a PRAL value of 13. This difference demonstrates that rabbit meat is considerably more acid-producing than pork meat.
Weight Loss & Diets
Vegan/ Vegetarian: Rabbit meat and pork come from animals and are not compatible with vegan or vegetarian diets.
Mediterranean: Red meat, including pork, is consumed in smaller quantities and less frequently. Lean meat like rabbit can be a good option if consumed in moderation and prepared healthily.
Keto: The keto diet includes low-carb, high-fat, and high-protein foods.
Rabbit meat, in particular, is very lean and can be a good choice for those following a ketogenic diet. Depending on the cut, pork can also be a suitable option, but you should choose cuts that are not heavily processed or contain added sugars.
Paleo: The paleo diet emphasizes eating natural, unadulterated foods and avoiding manufactured foods. Rabbit meat and pork meat are paleo-friendly.
DASH: Rabbit meat and pork can be part of the DASH (Dietary Approaches to Stop Hypertension) diet, but you should consume it in moderation and choose wisely. Lean cuts of pork and rabbit meat can fit into this diet. It's important to avoid high-fat cuts of pork.
Health Impact
Cardiovascular Health
Studies suggest that higher poultry consumption is either neutral or beneficially linked to cardiovascular disease (CVD), coronary heart disease (CHD), ischemic heart disease, and stroke. However, its association with blood pressure and hypertension is adverse (2).
While red meat has long been linked to a higher risk of cardiovascular diseases (CVDs), recent research suggests that when consumed in recommended amounts, red meat does not significantly increase this risk despite containing heme iron and carnitine (3).
Cancer
The analysis indicates an elevated cancer risk in individuals consuming large amounts of red and processed meats, whereas not in those with a high intake of white meat or poultry.
According to the study, greater consumption of pork did not increase the risk of cancer, while consuming high quantities of beef was significantly linked to cancer (4).
The World Health Organization (WHO) states that consumption of red and processed meats is linked to a higher risk of colorectal cancer (CRC). The evidence from various studies suggests that red meat and processed meat can increase CRC risk by 20-30%. Specific types of red meat, such as pork, beef, and lamb, have been associated with increased risk in different trials, with pork consumption linked to rectal cancer and lamb consumption linked to colon cancer in one trial each. There is also an association between beef and pork consumption and colon cancer in women in one trial.
Current guidelines recommend limiting red meat intake to 500 g per week or 70 g per day for healthy individuals and suggest limiting processed meat intake. In contrast, white meat, including rabbit meat consumption, is not associated with an increased risk of CRC and is considered safe (5).
Gouty Arthritis
A gout is a form of arthritis characterized by sudden and severe pain attacks, redness, and joint swelling. Following a gout diet can help lower uric acid levels, reducing the risk of gout attacks and slowing joint damage progression. Even when following a gout diet, people with gout still need medication to manage pain and lower uric acid levels.
Lean meats like rabbit or chicken can be consumed in moderation as part of a gout diet (6).
On the other hand, higher red meat intake is associated with a higher risk of gout (7).
Downsides and Risks
Foodborne Diseases
Pork must be cooked thoroughly to kill parasites and bacteria like Trichinella spiralis, which causes trichinosis. Cooking pork to an internal temperature of 145°F (62.8°C) eliminates these risks. Allowing meat to rest for three minutes before carving or consuming is recommended for safety and quality. Other bacteria like Escherichia coli, Salmonella, Staphylococcus aureus, and Listeria monocytogenes can also be present in pork but are destroyed by proper handling and thorough cooking (8).
Tularemia
Tularemia, or rabbit fever, is a rare disease caused by the bacterium Francisella tularensis. It is associated with rabbit hunting and consuming rabbit meat. It can spread to humans through consuming undercooked meat. Rabbit hunters are at higher risk due to contact when skinning rabbits.
Symptoms vary depending on the infection route but can include fever, throat pain, mouth ulcers, and vomiting. Symptoms typically appear within 3-14 days (9).
Appearance
Rabbit meat is typically lighter in color, ranging from pink to white, similar to chicken meat. Unlike it, pork meat is generally pink to pale red, depending on the cut and age of the animal.
Rabbit meat has a finer and more tender texture than pork, varying from tender to firmer depending on the cut and cooking method.
Pork is available in different cuts, including chops, ribs, loins, bellies, and more, each with its appearance and characteristics. On the other hand, rabbit meat is often sold in whole or in cuts, such as legs or loins, and may be less varied in terms of cuts available.
Taste and Use
The flavor of rabbit and pork meat can vary by factors such as the animal's diet, age, and cooking method. Overall, rabbit meat is leaner and milder, making it a versatile option for various dishes. Rabbit meat has a slightly sweet flavor similar to chicken but with a gamey or earthy undertone.
Pork has a richer, more robust flavor compared to rabbit meat. The taste of pork can vary, but it is generally savory and can be slightly sweet. Pork can have a juicy, tender texture, especially when cooked properly.
You can cook both in various ways, including roasting, grilling, braising, and frying.
Varieties
There are different types of rabbit meat, such as fryer, roaster, and stewing rabbit. Similarly, pork has various types: pork loin, pork chops, pork tenderloin, pork shoulder or pork butt, pork belly, pork ribs, and ground pork.
Sources
- https://ask.usda.gov/s/article/Is-pork-white-meat
- https://www.mdpi.com/2072-6643/15/16/3550
- https://www.ncbi.nlm.nih.gov/pmc/articles/PMC5474906/
- https://pubmed.ncbi.nlm.nih.gov/26633248/
- https://www.ncbi.nlm.nih.gov/pmc/articles/PMC4698595/
- https://pubmed.ncbi.nlm.nih.gov/21669599/
- https://www.ncbi.nlm.nih.gov/pmc/articles/PMC9300548/
- https://ask.usda.gov/s/article/
- https://www.ncbi.nlm.nih.gov/books/NBK430905/

Infographic
All nutrients comparison - raw data values
| Nutrient | |
|
DV% diff. |
| Vitamin B12 | 6.51µg | 0.57µg | 248% |
| Vitamin B1 | 0.02mg | 0.95mg | 78% |
| Iron | 4.85mg | 1.15mg | 46% |
| Selenium | 15.2µg | 38.2µg | 42% |
| Vitamin B6 | 0.34mg | 0.739mg | 31% |
| Vitamin B2 | 0.07mg | 0.387mg | 24% |
| Vitamin B5 | 1.012mg | 20% | |
| Cholesterol | 123mg | 73mg | 17% |
| Protein | 33.02g | 26.17g | 14% |
| Copper | 0.176mg | 0.111mg | 7% |
| Choline | 129.9mg | 88.9mg | 7% |
| Vitamin B3 | 6.4mg | 7.432mg | 6% |
| Phosphorus | 240mg | 267mg | 4% |
| Calories | 173kcal | 143kcal | 2% |
| Potassium | 343mg | 421mg | 2% |
| Vitamin E | 0.41mg | 0.08mg | 2% |
| Folate | 8µg | 0µg | 2% |
| Vitamin D* | 0 IU | 10 IU | 1% |
| Vitamin D | 0µg | 0.2µg | 1% |
| Calcium | 18mg | 6mg | 1% |
| Sodium | 45mg | 57mg | 1% |
| Manganese | 0.013mg | 1% | |
| Vitamin K | 1.5µg | 0µg | 1% |
| Saturated fat | 1.05g | 1.198g | 1% |
| Monounsaturated fat | 0.95g | 1.334g | 1% |
| Polyunsaturated fat | 0.68g | 0.506g | 1% |
| Protein per 100 calories | 19g | 18g | N/A |
| Calories per 10 g protein | 52kcal | 55kcal | N/A |
| Weight per 100 calories | 58g | 70g | N/A |
| Fats | 3.51g | 3.51g | 0% |
| Unsaturated / Saturated Fat ratio | 1.6 | 1.5 | N/A |
| Magnesium | 31mg | 29mg | 0% |
| Zinc | 2.38mg | 2.42mg | 0% |
| Trans fat | 0.033g | N/A | |
| Tryptophan | 0.436mg | 0.275mg | 0% |
| Threonine | 1.477mg | 1.175mg | 0% |
| Isoleucine | 1.567mg | 1.288mg | 0% |
| Leucine | 2.573mg | 2.229mg | 0% |
| Lysine | 2.891mg | 2.427mg | 0% |
| Methionine | 0.826mg | 0.721mg | 0% |
| Phenylalanine | 1.355mg | 1.1mg | 0% |
| Valine | 1.678mg | 1.367mg | 0% |
| Histidine | 0.926mg | 1.13mg | 0% |
| Omega-3 - ALA | 0.013g | N/A | |
| Omega-6 - Eicosadienoic acid | 0.013g | N/A | |
| Omega-6 - Linoleic acid | 0.411g | N/A |
References
All the values for which the sources are not specified explicitly are taken from FDA’s Food Central. The exact link to the food presented on this page can be found below.
- Rabbit Meat - https://fdc.nal.usda.gov/fdc-app.html#/food-details/174348/nutrients
- Pork Meat - https://fdc.nal.usda.gov/fdc-app.html#/food-details/168250/nutrients
All the Daily Values are presented for males aged 31-50, for 2000-calorie diets.