Raisin vs. Cranberries — In-Depth Nutrition Comparison
Compare
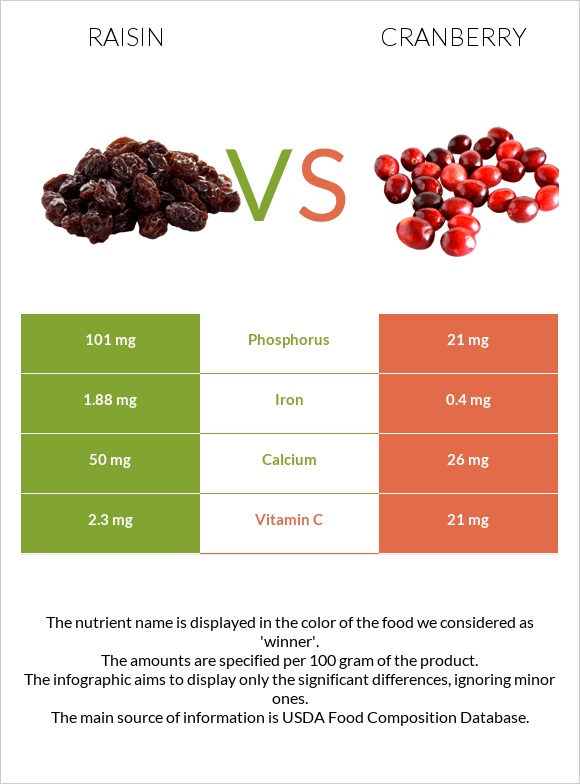
How are raisins and cranberries different?
- Raisins are richer in iron, phosphorus, and vitamin B1, while cranberries are higher in vitamin C.
- Cranberries cover your daily need for vitamin C, 21% more than raisins.
- Raisins contain 5 times more vitamin B1 than cranberries. Raisins contain 0.106mg of vitamin B1, while cranberries contain 0.02mg.
- Raisins have a higher glycemic index (64) than cranberries (45).
Raisins, seedless and Cranberry, low bush or lingenberry, raw (Alaska Native) types were used in this article.
Infographic
Infographic link
Mineral Comparison
Mineral comparison score is based on the number of minerals by which one or the other food is richer. The "coverage" charts below show how much of the daily needs can be covered by 300 grams of the food.
| Contains more MagnesiumMagnesium | +∞% |
| Contains more CalciumCalcium | +92.3% |
| Contains more PotassiumPotassium | +∞% |
| Contains more IronIron | +370% |
| Contains more CopperCopper | +∞% |
| Contains more ZincZinc | +∞% |
| Contains more PhosphorusPhosphorus | +381% |
| Contains more ManganeseManganese | +∞% |
| Contains more SeleniumSelenium | +∞% |
Vitamin Comparison
Vitamin comparison score is based on the number of vitamins by which one or the other food is richer. The "coverage" charts below show how much of the daily needs can be covered by 300 grams of the food.
| Contains more Vitamin EVitamin E | +∞% |
| Contains more Vitamin B1Vitamin B1 | +430% |
| Contains more Vitamin B2Vitamin B2 | +56.3% |
| Contains more Vitamin B3Vitamin B3 | +91.5% |
| Contains more Vitamin B5Vitamin B5 | +∞% |
| Contains more Vitamin B6Vitamin B6 | +∞% |
| Contains more Vitamin KVitamin K | +∞% |
| Contains more FolateFolate | +∞% |
| Contains more Vitamin CVitamin C | +813% |
All nutrients comparison - raw data values
| Nutrient |  |
 |
DV% diff. |
| Fructose | 29.68g | 37% | |
| Copper | 0.318mg | 35% | |
| Carbs | 79.18g | 12.2g | 22% |
| Potassium | 749mg | 22% | |
| Vitamin C | 2.3mg | 21mg | 21% |
| Iron | 1.88mg | 0.4mg | 19% |
| Fiber | 3.7g | 15% | |
| Manganese | 0.299mg | 13% | |
| Vitamin B6 | 0.174mg | 13% | |
| Calories | 299kcal | 55kcal | 12% |
| Phosphorus | 101mg | 21mg | 11% |
| Magnesium | 32mg | 8% | |
| Vitamin B1 | 0.106mg | 0.02mg | 7% |
| Protein | 3.07g | 0.4g | 5% |
| Vitamin B2 | 0.125mg | 0.08mg | 3% |
| Vitamin K | 3.5µg | 3% | |
| Calcium | 50mg | 26mg | 2% |
| Zinc | 0.22mg | 2% | |
| Vitamin B3 | 0.766mg | 0.4mg | 2% |
| Vitamin B5 | 0.095mg | 2% | |
| Choline | 11.1mg | 2% | |
| Starch | 2.7g | 1% | |
| Vitamin E | 0.12mg | 1% | |
| Selenium | 0.6µg | 1% | |
| Folate | 5µg | 1% | |
| Protein per 100 calories | 1g | 0.73g | N/A |
| Calories per 10 g protein | 974kcal | 1375kcal | N/A |
| Weight per 100 calories | 33g | 182g | N/A |
| Fats | 0.46g | 0.5g | 0% |
| Net carbs | 75.48g | 12.2g | N/A |
| Sugar | 59.19g | N/A | |
| Sodium | 11mg | 0% | |
| Saturated fat | 0.058g | 0% | |
| Monounsaturated fat | 0.051g | 0% | |
| Polyunsaturated fat | 0.037g | 0% | |
| Tryptophan | 0.05mg | 0% | |
| Threonine | 0.077mg | 0% | |
| Isoleucine | 0.057mg | 0% | |
| Leucine | 0.096mg | 0% | |
| Lysine | 0.084mg | 0% | |
| Methionine | 0.021mg | 0% | |
| Phenylalanine | 0.065mg | 0% | |
| Valine | 0.083mg | 0% | |
| Histidine | 0.072mg | 0% | |
| Omega-6 - Gamma-linoleic acid | 0.001g | N/A |
Macronutrient Comparison
Macronutrient breakdown side-by-side comparison
Protein:
3.07 g
Fats:
0.46 g
Carbs:
79.18 g
Water:
15.43 g
Other:
1.86 g
Protein:
0.4 g
Fats:
0.5 g
Carbs:
12.2 g
Water:
86.7 g
Other:
0.2 g
| Contains more ProteinProtein | +667.5% |
| Contains more CarbsCarbs | +549% |
| Contains more OtherOther | +830% |
| Contains more WaterWater | +461.9% |
~equal in
Fats
~0.5g