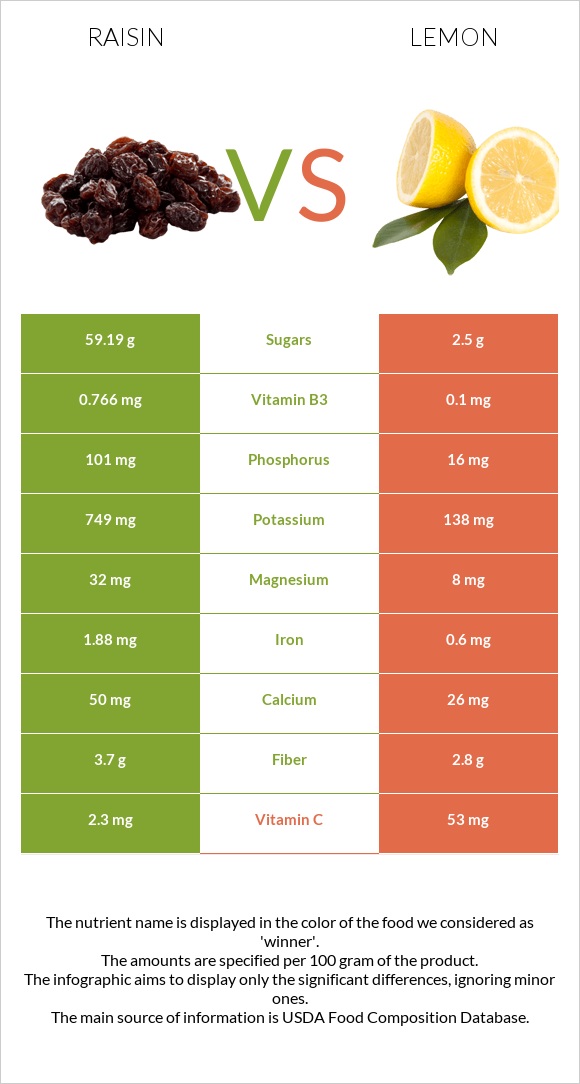
How are raisins and lemons different? Raisins are richer in copper, potassium, iron, phosphorus, manganese, vitamin B2, vitamin B6, magnesium, and vitamin B1, while lemons are higher in vitamin C. Lemons cover your daily need for vitamin C, 56% more than raisins. Raisins contain 10 times more manganese than lemons. Raisins contain 0.299mg of manganese, while lemons contain 0.03mg. Raisins, seedless and Lemons, raw, without peel types were used in this article.
Infographic
Mineral Comparison
Mineral comparison score is based on the number of minerals by which one or the other food is richer. The "coverage" charts below show how much of the daily needs can be covered by 300 grams of the food.
9
100 g
300 g
1 miniature box (.5 oz) - 14g 50 raisins - 26g 1 oz (60 raisins) - 28.35g 1 small box (1.5 oz) - 43g 1 cup (not packed) - 145g 1 cup, packed - 165g
Magnesium
Magnesium
Calcium
Calcium
Potassium
Potassium
Iron
Iron
Copper
Copper
Zinc
Zinc
Phosphorus
Phosphorus
Sodium
Sodium
Manganese
Manganese
Selenium
Selenium
23%
15%
66%
71%
106%
6%
43%
1.4%
39%
3.3%
1
100 g
300 g
1 wedge or slice (1/8 of one 2-1/8" dia lemon) - 7g 1 fruit (2-1/8" dia) - 58g 1 NLEA serving - 58g 1 fruit (2-3/8" dia) - 84g 1 cup, sections - 212g
Magnesium
Magnesium
Calcium
Calcium
Potassium
Potassium
Iron
Iron
Copper
Copper
Zinc
Zinc
Phosphorus
Phosphorus
Sodium
Sodium
Manganese
Manganese
Selenium
Selenium
5.7%
7.8%
12%
23%
12%
1.6%
6.9%
0.26%
3.9%
2.2%
Vitamin Comparison
Vitamin comparison score is based on the number of vitamins by which one or the other food is richer. The "coverage" charts below show how much of the daily needs can be covered by 300 grams of the food.
5
100 g
300 g
1 miniature box (.5 oz) - 14g 50 raisins - 26g 1 oz (60 raisins) - 28.35g 1 small box (1.5 oz) - 43g 1 cup (not packed) - 145g 1 cup, packed - 165g
Vitamin C
Vit. C
Vitamin D
Vit. D
Vitamin A
Vit. A
Vitamin E
Vit. E
Vitamin B1
Vit. B1
Vitamin B2
Vit. B2
Vitamin B3
Vit. B3
Vitamin B5
Vit. B5
Vitamin B6
Vit. B6
Vitamin B12
Vit. B12
Vitamin K
Vit. K
Folate
Folate
7.7%
0%
0%
2.4%
27%
29%
14%
5.7%
40%
0%
8.8%
3.8%
5
100 g
300 g
1 wedge or slice (1/8 of one 2-1/8" dia lemon) - 7g 1 fruit (2-1/8" dia) - 58g 1 NLEA serving - 58g 1 fruit (2-3/8" dia) - 84g 1 cup, sections - 212g
Vitamin C
Vit. C
Vitamin D
Vit. D
Vitamin A
Vit. A
Vitamin E
Vit. E
Vitamin B1
Vit. B1
Vitamin B2
Vit. B2
Vitamin B3
Vit. B3
Vitamin B5
Vit. B5
Vitamin B6
Vit. B6
Vitamin B12
Vit. B12
Vitamin K
Vit. K
Folate
Folate
177%
0%
0.33%
3%
10%
4.6%
1.9%
11%
18%
0%
0%
8.3%
All nutrients comparison - raw data values
Nutrient
DV% diff.
Vitamin C
2.3mg
53mg
56%
Fructose
29.68g
37%
Copper
0.318mg
0.037mg
31%
Carbs
79.18g
9.32g
23%
Potassium
749mg
138mg
18%
Iron
1.88mg
0.6mg
16%
Calories
299kcal
29kcal
14%
Phosphorus
101mg
16mg
12%
Manganese
0.299mg
0.03mg
12%
Vitamin B2
0.125mg
0.02mg
8%
Vitamin B6
0.174mg
0.08mg
7%
Magnesium
32mg
8mg
6%
Vitamin B1
0.106mg
0.04mg
6%
Protein
3.07g
1.1g
4%
Fiber
3.7g
2.8g
4%
Vitamin B3
0.766mg
0.1mg
4%
Vitamin K
3.5µg
0µg
3%
Calcium
50mg
26mg
2%
Vitamin B5
0.095mg
0.19mg
2%
Folate
5µg
11µg
2%
Zinc
0.22mg
0.06mg
1%
Starch
2.7g
1%
Choline
11.1mg
5.1mg
1%
Protein per 100 calories
1g
3.8g
N/A
Calories per 10 g protein
974kcal
264kcal
N/A
Weight per 100 calories
33g
345g
N/A
Fats
0.46g
0.3g
0%
Net carbs
75.48g
6.52g
N/A
Sugar
59.19g
2.5g
N/A
Sodium
11mg
2mg
0%
Vitamin A
0µg
1µg
0%
Vitamin E
0.12mg
0.15mg
0%
Selenium
0.6µg
0.4µg
0%
Saturated fat
0.058g
0.039g
0%
Monounsaturated fat
0.051g
0.011g
0%
Polyunsaturated fat
0.037g
0.089g
0%
Tryptophan
0.05mg
0%
Threonine
0.077mg
0%
Isoleucine
0.057mg
0%
Leucine
0.096mg
0%
Lysine
0.084mg
0%
Methionine
0.021mg
0%
Phenylalanine
0.065mg
0%
Valine
0.083mg
0%
Histidine
0.072mg
0%
Omega-6 - Gamma-linoleic acid
0.001g
N/A
Macronutrient Comparison
Macronutrient breakdown side-by-side comparison
4
3%
79%
15%
2%
Protein:
3.07 g
Fats:
0.46 g
Carbs:
79.18 g
Water:
15.43 g
Other:
1.86 g
1
9%
89%
Protein:
1.1 g
Fats:
0.3 g
Carbs:
9.32 g
Water:
88.98 g
Other:
0.3 g
Contains
more
Protein Protein
+179.1%
Contains
more
Fats Fats
+53.3%
Contains
more
Carbs Carbs
+749.6%
Contains
more
Other Other
+520%
Contains
more
Water Water
+476.7%
Fat Type Comparison
Fat type breakdown side-by-side comparison
1
40%
35%
25%
Saturated fat:
Sat. Fat
0.058 g
Monounsaturated fat:
Mono. Fat
0.051 g
Polyunsaturated fat:
Poly. Fat
0.037 g
2
28%
8%
64%
Saturated fat:
Sat. Fat
0.039 g
Monounsaturated fat:
Mono. Fat
0.011 g
Polyunsaturated fat:
Poly. Fat
0.089 g
Contains
more
Mono. Fat Monounsaturated fat
+363.6%
Contains
less
Sat. Fat Saturated fat
-32.8%
Contains
more
Poly. Fat Polyunsaturated fat
+140.5%