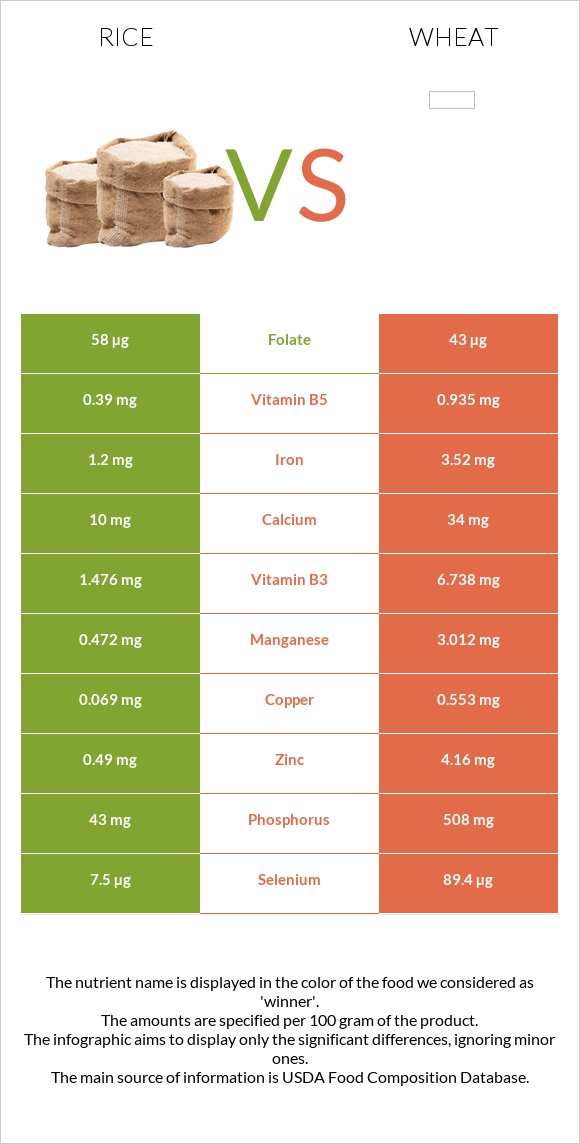
Differences between rice and wheat Rice contains less selenium, manganese, phosphorus, copper, zinc, vitamin B3, magnesium, iron, vitamin B6, and vitamin B1 than wheat . Wheat 's daily need coverage for selenium is 149% higher. The food types used in this comparison are Rice, white, long-grain, regular, enriched, cooked and Wheat, durum .
Infographic
Mineral Comparison
Mineral comparison score is based on the number of minerals by which one or the other food is richer. The "coverage" charts below show how much of the daily needs can be covered by 300 grams of the food.
1
100 g
300 g
1 cup - 158g
Magnesium
Magnesium
Calcium
Calcium
Potassium
Potassium
Iron
Iron
Copper
Copper
Zinc
Zinc
Phosphorus
Phosphorus
Sodium
Sodium
Manganese
Manganese
Selenium
Selenium
8.6%
3%
3.1%
45%
23%
13%
18%
0.13%
62%
41%
9
100 g
300 g
1 cup - 192g
Magnesium
Magnesium
Calcium
Calcium
Potassium
Potassium
Iron
Iron
Copper
Copper
Zinc
Zinc
Phosphorus
Phosphorus
Sodium
Sodium
Manganese
Manganese
Selenium
Selenium
103%
10%
38%
132%
184%
113%
218%
0.26%
393%
488%
Vitamin Comparison
Vitamin comparison score is based on the number of vitamins by which one or the other food is richer. The "coverage" charts below show how much of the daily needs can be covered by 300 grams of the food.
2
100 g
300 g
1 cup - 158g
Vitamin C
Vit. C
Vitamin D
Vit. D
Vitamin A
Vit. A
Vitamin E
Vit. E
Vitamin B1
Vit. B1
Vitamin B2
Vit. B2
Vitamin B3
Vit. B3
Vitamin B5
Vit. B5
Vitamin B6
Vit. B6
Vitamin B12
Vit. B12
Vitamin K
Vit. K
Folate
Folate
0%
0%
0%
0.8%
41%
3%
28%
23%
21%
0%
0%
44%
5
100 g
300 g
1 cup - 192g
Vitamin C
Vit. C
Vitamin D
Vit. D
Vitamin A
Vit. A
Vitamin E
Vit. E
Vitamin B1
Vit. B1
Vitamin B2
Vit. B2
Vitamin B3
Vit. B3
Vitamin B5
Vit. B5
Vitamin B6
Vit. B6
Vitamin B12
Vit. B12
Vitamin K
Vit. K
Folate
Folate
0%
0%
0%
0%
105%
28%
126%
56%
97%
0%
0%
32%
All nutrients comparison - raw data values
Nutrient
DV% diff.
Selenium
7.5µg
89.4µg
149%
Manganese
0.472mg
3.012mg
110%
Phosphorus
43mg
508mg
66%
Copper
0.069mg
0.553mg
54%
Zinc
0.49mg
4.16mg
33%
Vitamin B3
1.476mg
6.738mg
33%
Magnesium
12mg
144mg
31%
Iron
1.2mg
3.52mg
29%
Vitamin B6
0.093mg
0.419mg
25%
Protein
2.69g
13.68g
22%
Vitamin B1
0.163mg
0.419mg
21%
Carbs
28.17g
71.13g
14%
Potassium
35mg
431mg
12%
Vitamin B5
0.39mg
0.935mg
11%
Calories
130kcal
339kcal
10%
Vitamin B2
0.013mg
0.121mg
8%
Polyunsaturated fat
0.076g
0.978g
6%
Folate
58µg
43µg
4%
Fats
0.28g
2.47g
3%
Calcium
10mg
34mg
2%
Fiber
0.4g
2%
Saturated fat
0.077g
0.454g
2%
Monounsaturated fat
0.088g
0.344g
1%
Protein per 100 calories
2.1g
4g
N/A
Calories per 10 g protein
483kcal
248kcal
N/A
Weight per 100 calories
77g
29g
N/A
Unsaturated / Saturated Fat ratio
2.1
2.9
N/A
Net carbs
27.77g
71.13g
N/A
Sugar
0.05g
N/A
Sodium
1mg
2mg
0%
Vitamin E
0.04mg
0%
Choline
2.1mg
0%
Tryptophan
0.031mg
0.176mg
0%
Threonine
0.096mg
0.366mg
0%
Isoleucine
0.116mg
0.533mg
0%
Leucine
0.222mg
0.934mg
0%
Lysine
0.097mg
0.303mg
0%
Methionine
0.063mg
0.221mg
0%
Phenylalanine
0.144mg
0.681mg
0%
Valine
0.164mg
0.594mg
0%
Histidine
0.063mg
0.322mg
0%
Macronutrient Comparison
Macronutrient breakdown side-by-side comparison
1
3%
28%
68%
Protein:
2.69 g
Fats:
0.28 g
Carbs:
28.17 g
Water:
68.44 g
Other:
0.42 g
4
14%
2%
71%
11%
2%
Protein:
13.68 g
Fats:
2.47 g
Carbs:
71.13 g
Water:
10.94 g
Other:
1.78 g
Contains
more
Water Water
+525.6%
Contains
more
Protein Protein
+408.6%
Contains
more
Fats Fats
+782.1%
Contains
more
Carbs Carbs
+152.5%
Contains
more
Other Other
+323.8%
Fat Type Comparison
Fat type breakdown side-by-side comparison
1
32%
37%
32%
Saturated fat:
Sat. Fat
0.077 g
Monounsaturated fat:
Mono. Fat
0.088 g
Polyunsaturated fat:
Poly. Fat
0.076 g
2
26%
19%
55%
Saturated fat:
Sat. Fat
0.454 g
Monounsaturated fat:
Mono. Fat
0.344 g
Polyunsaturated fat:
Poly. Fat
0.978 g
Contains
less
Sat. Fat Saturated fat
-83%
Contains
more
Mono. Fat Monounsaturated fat
+290.9%
Contains
more
Poly. Fat Polyunsaturated fat
+1186.8%