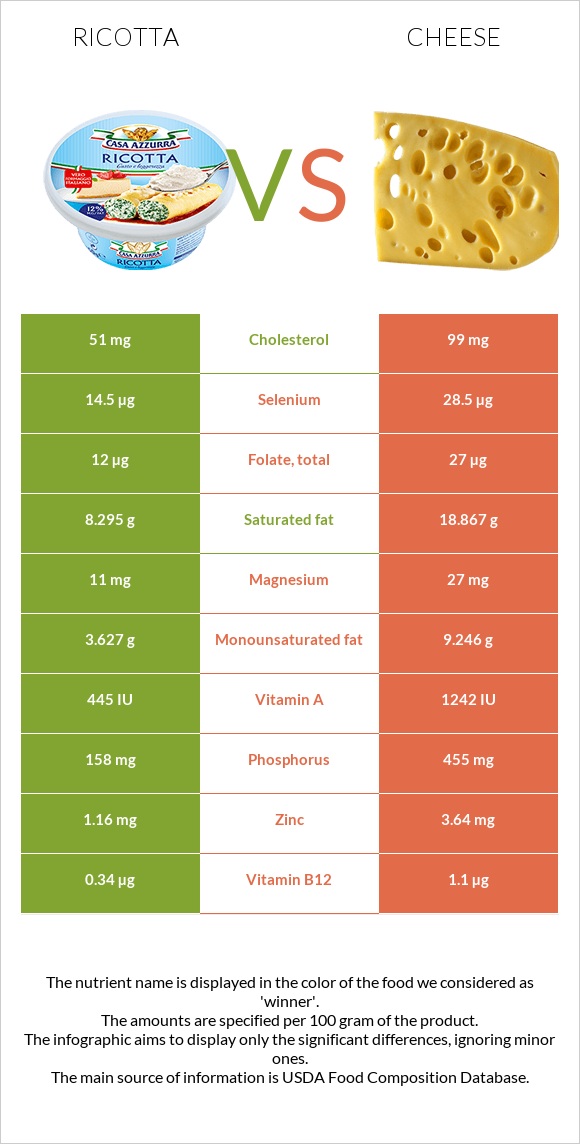
A recap on the differences between ricotta and cheese Cheese is higher than ricotta in calcium, phosphorus, vitamin B12, selenium, zinc, vitamin B2, and vitamin A. Cheese covers your daily saturated fat needs 53% more than ricotta. The glycemic index of cheese is lower. Food varieties used in this article are Cheese, ricotta, whole milk and Cheese, cheddar .
Infographic
Mineral Comparison
Mineral comparison score is based on the number of minerals by which one or the other food is richer. The "coverage" charts below show how much of the daily needs can be covered by 300 grams of the food.
3
100 g
300 g
1 small cup - 55g 0.5 cup - 124g 1 cup - 246g
Magnesium
Magnesium
Calcium
Calcium
Potassium
Potassium
Iron
Iron
Copper
Copper
Zinc
Zinc
Phosphorus
Phosphorus
Sodium
Sodium
Manganese
Manganese
Selenium
Selenium
7.9%
62%
9.3%
14%
7%
32%
68%
11%
0.78%
79%
7
100 g
300 g
1 cubic inch - 17g 1 slice (1 oz) - 28g 1 oz - 28.35g 1 cup, shredded - 113g 1 cup, diced - 132g 1 cup, melted - 244g
Magnesium
Magnesium
Calcium
Calcium
Potassium
Potassium
Iron
Iron
Copper
Copper
Zinc
Zinc
Phosphorus
Phosphorus
Sodium
Sodium
Manganese
Manganese
Selenium
Selenium
19%
213%
6.7%
5.3%
10%
99%
195%
85%
3.5%
155%
Vitamin Comparison
Vitamin comparison score is based on the number of vitamins by which one or the other food is richer. The "coverage" charts below show how much of the daily needs can be covered by 300 grams of the food.
1
100 g
300 g
1 small cup - 55g 0.5 cup - 124g 1 cup - 246g
Vitamin C
Vit. C
Vitamin D
Vit. D
Vitamin A
Vit. A
Vitamin E
Vit. E
Vitamin B1
Vit. B1
Vitamin B2
Vit. B2
Vitamin B3
Vit. B3
Vitamin B5
Vit. B5
Vitamin B6
Vit. B6
Vitamin B12
Vit. B12
Vitamin K
Vit. K
Folate
Folate
0%
3%
40%
2.2%
3.3%
45%
2%
13%
9.9%
43%
2.8%
9%
10
100 g
300 g
1 cubic inch - 17g 1 slice (1 oz) - 28g 1 oz - 28.35g 1 cup, shredded - 113g 1 cup, diced - 132g 1 cup, melted - 244g
Vitamin C
Vit. C
Vitamin D
Vit. D
Vitamin A
Vit. A
Vitamin E
Vit. E
Vitamin B1
Vit. B1
Vitamin B2
Vit. B2
Vitamin B3
Vit. B3
Vitamin B5
Vit. B5
Vitamin B6
Vit. B6
Vitamin B12
Vit. B12
Vitamin K
Vit. K
Folate
Folate
0%
9%
110%
14%
7.3%
99%
1.1%
25%
15%
138%
6%
20%
All nutrients comparison - raw data values
Nutrient
DV% diff.
Calcium
207mg
710mg
50%
Saturated fat
8.295g
18.867g
48%
Phosphorus
158mg
455mg
42%
Vitamin B12
0.34µg
1.1µg
32%
Fats
12.98g
33.31g
31%
Sodium
84mg
653mg
25%
Selenium
14.5µg
28.5µg
25%
Protein
11.26g
22.87g
23%
Zinc
1.16mg
3.64mg
23%
Vitamin A
120µg
330µg
23%
Vitamin B2
0.195mg
0.428mg
18%
Cholesterol
51mg
99mg
16%
Monounsaturated fat
3.627g
9.246g
14%
Calories
174kcal
404kcal
12%
Polyunsaturated fat
0.385g
1.421g
7%
Magnesium
11mg
27mg
4%
Vitamin E
0.11mg
0.71mg
4%
Vitamin B5
0.213mg
0.41mg
4%
Folate
12µg
27µg
4%
Iron
0.38mg
0.14mg
3%
Vitamin D*
10 IU
24 IU
2%
Vitamin D
0.2µg
0.6µg
2%
Vitamin B6
0.043mg
0.066mg
2%
Potassium
105mg
76mg
1%
Copper
0.021mg
0.03mg
1%
Manganese
0.006mg
0.027mg
1%
Vitamin B1
0.013mg
0.029mg
1%
Vitamin K
1.1µg
2.4µg
1%
Protein per 100 calories
6.5g
5.7g
N/A
Calories per 10 g protein
155kcal
177kcal
N/A
Weight per 100 calories
57g
25g
N/A
Unsaturated / Saturated Fat ratio
0.48
0.57
N/A
Net carbs
3.04g
3.09g
N/A
Carbs
3.04g
3.09g
0%
Sugar
0.27g
0.48g
N/A
Vitamin B3
0.104mg
0.059mg
0%
Trans fat
0.917g
N/A
Choline
17.5mg
16.5mg
0%
Tryptophan
0.125mg
0.547mg
0%
Threonine
0.517mg
1.044mg
0%
Isoleucine
0.589mg
1.206mg
0%
Leucine
1.221mg
1.939mg
0%
Lysine
1.338mg
1.025mg
0%
Methionine
0.281mg
0.547mg
0%
Phenylalanine
0.556mg
1.074mg
0%
Valine
0.692mg
1.404mg
0%
Histidine
0.459mg
0.547mg
0%
Omega-3 - EPA
0g
0.01g
N/A
Omega-3 - DHA
0g
0.001g
N/A
Omega-3 - DPA
0g
0.017g
N/A
Omega-6 - Eicosadienoic acid
0.007g
N/A
Macronutrient Comparison
Macronutrient breakdown side-by-side comparison
1
11%
13%
3%
72%
Protein:
11.26 g
Fats:
12.98 g
Carbs:
3.04 g
Water:
71.7 g
Other:
1.02 g
4
23%
33%
3%
37%
4%
Protein:
22.87 g
Fats:
33.31 g
Carbs:
3.09 g
Water:
37.02 g
Other:
3.71 g
Contains
more
Water Water
+93.7%
Contains
more
Protein Protein
+103.1%
Contains
more
Fats Fats
+156.6%
Contains
more
Other Other
+263.7%
Fat Type Comparison
Fat type breakdown side-by-side comparison
1
67%
29%
3%
Saturated fat:
Sat. Fat
8.295 g
Monounsaturated fat:
Mono. Fat
3.627 g
Polyunsaturated fat:
Poly. Fat
0.385 g
2
64%
31%
5%
Saturated fat:
Sat. Fat
18.867 g
Monounsaturated fat:
Mono. Fat
9.246 g
Polyunsaturated fat:
Poly. Fat
1.421 g
Contains
less
Sat. Fat Saturated fat
-56%
Contains
more
Mono. Fat Monounsaturated fat
+154.9%
Contains
more
Poly. Fat Polyunsaturated fat
+269.1%