Rolls, gluten-free, white, made with brown rice flour, tapioca starch, and sorghum flour vs. Pie crust — In-Depth Nutrition Comparison
Compare
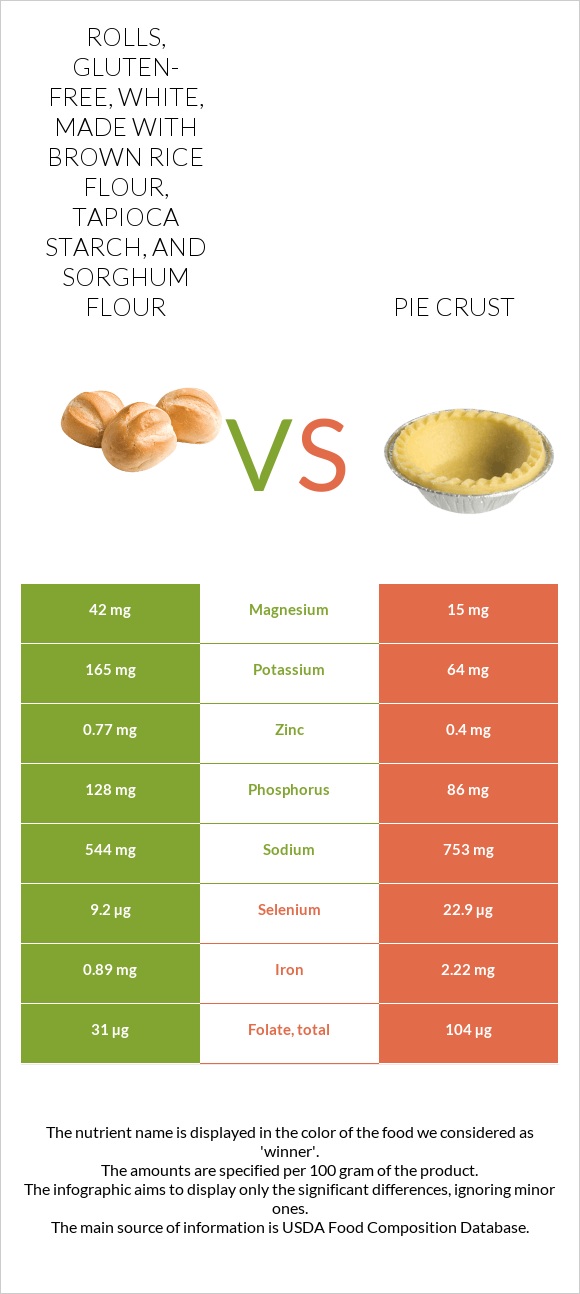
The main differences between rolls, gluten-free, white, made with brown rice flour, tapioca starch, and sorghum flour and pie crust
- Rolls, gluten-free, white, made with brown rice flour, tapioca starch, and sorghum flour has more manganese, magnesium, phosphorus, and vitamin B6; however, pie crust has more selenium, folate, iron, and vitamin B1.
- Daily need coverage for selenium for pie crust is 25% higher.
- Pie crust has 3 times less magnesium than rolls, gluten-free, white, made with brown rice flour, tapioca starch, and sorghum flour. Rolls, gluten-free, white, made with brown rice flour, tapioca starch, and sorghum flour has 42mg of magnesium, while pie crust has 15mg.
- Rolls, gluten-free, white, made with brown rice flour, tapioca starch, and sorghum flour is lower in sodium.
Food types used in this article are Rolls, gluten-free, white, made with brown rice flour, tapioca starch, and sorghum flour and Pie crust, standard-type, dry mix.
Infographic
Infographic link
Mineral Comparison
Mineral comparison score is based on the number of minerals by which one or the other food is richer. The "coverage" charts below show how much of the daily needs can be covered by 300 grams of the food.
| Contains more MagnesiumMagnesium | +180% |
| Contains more PotassiumPotassium | +157.8% |
| Contains more CopperCopper | +48% |
| Contains more ZincZinc | +92.5% |
| Contains more PhosphorusPhosphorus | +48.8% |
| Contains less SodiumSodium | -27.8% |
| Contains more ManganeseManganese | +113% |
| Contains more CalciumCalcium | +48.8% |
| Contains more IronIron | +149.4% |
| Contains more SeleniumSelenium | +148.9% |
Vitamin Comparison
Vitamin comparison score is based on the number of vitamins by which one or the other food is richer. The "coverage" charts below show how much of the daily needs can be covered by 300 grams of the food.
| Contains more Vitamin EVitamin E | +∞% |
| Contains more Vitamin B6Vitamin B6 | +118.8% |
| Contains more Vitamin B1Vitamin B1 | +56.8% |
| Contains more FolateFolate | +235.5% |
All nutrients comparison - raw data values
| Nutrient |  |
 |
DV% diff. |
| Monounsaturated fat | 17.887g | 45% | |
| Fats | 8.2g | 31.4g | 36% |
| Saturated fat | 7.974g | 36% | |
| Polyunsaturated fat | 3.968g | 26% | |
| Selenium | 9.2µg | 22.9µg | 25% |
| Folate | 31µg | 104µg | 18% |
| Iron | 0.89mg | 2.22mg | 17% |
| Vitamin B3 | 2.727mg | 17% | |
| Vitamin B2 | 0.213mg | 16% | |
| Manganese | 0.671mg | 0.315mg | 15% |
| Starch | 34.3g | 14% | |
| Calories | 257kcal | 518kcal | 13% |
| Fiber | 2.9g | 12% | |
| Vitamin B1 | 0.25mg | 0.392mg | 12% |
| Sodium | 544mg | 753mg | 9% |
| Magnesium | 42mg | 15mg | 6% |
| Phosphorus | 128mg | 86mg | 6% |
| Vitamin B6 | 0.14mg | 0.064mg | 6% |
| Vitamin B5 | 0.268mg | 5% | |
| Carbs | 40.24g | 52.1g | 4% |
| Copper | 0.111mg | 0.075mg | 4% |
| Protein | 5.65g | 6.9g | 3% |
| Potassium | 165mg | 64mg | 3% |
| Zinc | 0.77mg | 0.4mg | 3% |
| Vitamin E | 0.52mg | 3% | |
| Calcium | 41mg | 61mg | 2% |
| Fructose | 1.55g | 2% | |
| Protein per 100 calories | 2.2g | 1.3g | N/A |
| Calories per 10 g protein | 455kcal | 751kcal | N/A |
| Weight per 100 calories | 39g | 19g | N/A |
| Unsaturated / Saturated Fat ratio | 2.7 | N/A | |
| Net carbs | 37.34g | 52.1g | N/A |
| Sugar | 2.98g | N/A | |
| Tryptophan | 0.08mg | 0% | |
| Threonine | 0.184mg | 0% | |
| Isoleucine | 0.255mg | 0% | |
| Leucine | 0.476mg | 0% | |
| Lysine | 0.133mg | 0% | |
| Methionine | 0.121mg | 0% | |
| Phenylalanine | 0.339mg | 0% | |
| Valine | 0.289mg | 0% | |
| Histidine | 0.146mg | 0% |
Macronutrient Comparison
Macronutrient breakdown side-by-side comparison
Protein:
5.65 g
Fats:
8.2 g
Carbs:
40.24 g
Water:
44.6 g
Other:
1.31 g
Protein:
6.9 g
Fats:
31.4 g
Carbs:
52.1 g
Water:
7.6 g
Other:
2 g
| Contains more WaterWater | +486.8% |
| Contains more ProteinProtein | +22.1% |
| Contains more FatsFats | +282.9% |
| Contains more CarbsCarbs | +29.5% |
| Contains more OtherOther | +52.7% |