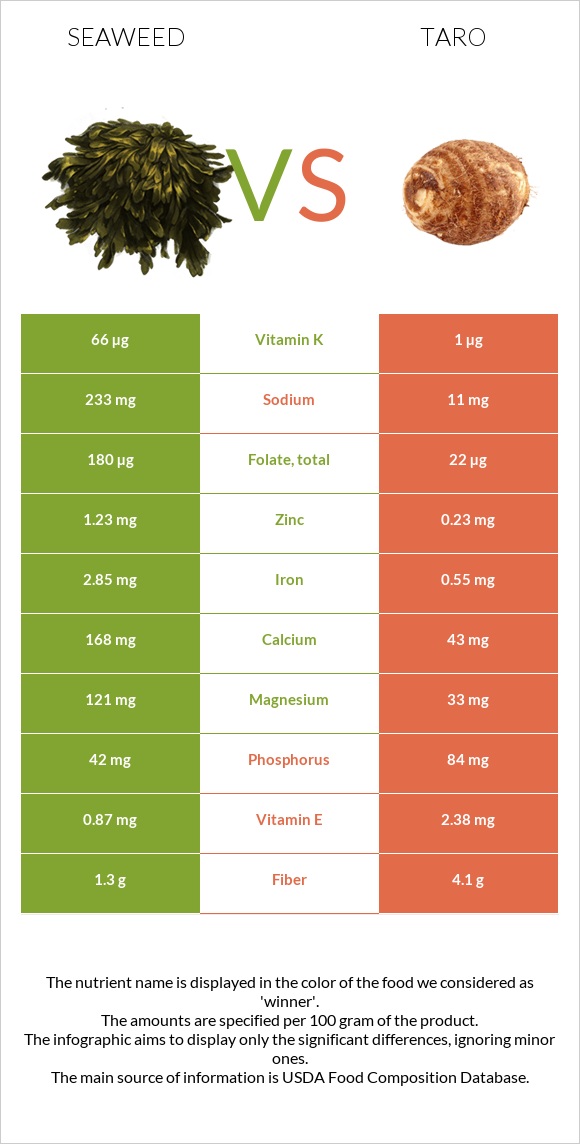
Summary of differences between seaweed and taro Seaweed has more vitamin K, folate, iron, magnesium, and calcium; however, taro is higher in vitamin B6, potassium, fiber, and vitamin E. Seaweed covers your daily need for vitamin K, 54% more than taro. Seaweed has 21 times more sodium than taro. While seaweed has 233mg of sodium, taro has only 11mg. These are the specific foods used in this comparison Seaweed, kelp, raw and Taro, raw .
Infographic
Mineral Comparison
Mineral comparison score is based on the number of minerals by which one or the other food is richer. The "coverage" charts below show how much of the daily needs can be covered by 300 grams of the food.
4
100 g
300 g
2 tbsp (1/8 cup) - 10g
Magnesium
Magnesium
Calcium
Calcium
Potassium
Potassium
Iron
Iron
Copper
Copper
Zinc
Zinc
Phosphorus
Phosphorus
Sodium
Sodium
Manganese
Manganese
Selenium
Selenium
86%
50%
7.9%
107%
43%
34%
18%
30%
26%
3.8%
5
100 g
300 g
1 cup, sliced - 104g
Magnesium
Magnesium
Calcium
Calcium
Potassium
Potassium
Iron
Iron
Copper
Copper
Zinc
Zinc
Phosphorus
Phosphorus
Sodium
Sodium
Manganese
Manganese
Selenium
Selenium
24%
13%
52%
21%
57%
6.3%
36%
1.4%
50%
3.8%
Vitamin Comparison
Vitamin comparison score is based on the number of vitamins by which one or the other food is richer. The "coverage" charts below show how much of the daily needs can be covered by 300 grams of the food.
5
100 g
300 g
2 tbsp (1/8 cup) - 10g
Vitamin C
Vit. C
Vitamin D
Vit. D
Vitamin A
Vit. A
Vitamin E
Vit. E
Vitamin B1
Vit. B1
Vitamin B2
Vit. B2
Vitamin B3
Vit. B3
Vitamin B5
Vit. B5
Vitamin B6
Vit. B6
Vitamin B12
Vit. B12
Vitamin K
Vit. K
Folate
Folate
10%
0%
2%
17%
13%
35%
8.8%
39%
0.46%
0%
165%
135%
5
100 g
300 g
1 cup, sliced - 104g
Vitamin C
Vit. C
Vitamin D
Vit. D
Vitamin A
Vit. A
Vitamin E
Vit. E
Vitamin B1
Vit. B1
Vitamin B2
Vit. B2
Vitamin B3
Vit. B3
Vitamin B5
Vit. B5
Vitamin B6
Vit. B6
Vitamin B12
Vit. B12
Vitamin K
Vit. K
Folate
Folate
15%
0%
1.3%
48%
24%
5.8%
11%
18%
65%
0%
2.5%
17%
All nutrients comparison - raw data values
Nutrient
DV% diff.
Vitamin K
66µg
1µg
54%
Folate
180µg
22µg
40%
Iron
2.85mg
0.55mg
29%
Vitamin B6
0.002mg
0.283mg
22%
Magnesium
121mg
33mg
21%
Potassium
89mg
591mg
15%
Calcium
168mg
43mg
13%
Fiber
1.3g
4.1g
11%
Sodium
233mg
11mg
10%
Vitamin E
0.87mg
2.38mg
10%
Vitamin B2
0.15mg
0.025mg
10%
Zinc
1.23mg
0.23mg
9%
Manganese
0.2mg
0.383mg
8%
Vitamin B5
0.642mg
0.303mg
7%
Carbs
9.57g
26.46g
6%
Phosphorus
42mg
84mg
6%
Copper
0.13mg
0.172mg
5%
Vitamin B1
0.05mg
0.095mg
4%
Calories
43kcal
112kcal
3%
Vitamin C
3mg
4.5mg
2%
Fats
0.56g
0.2g
1%
Vitamin B3
0.47mg
0.6mg
1%
Choline
12.8mg
17.3mg
1%
Saturated fat
0.247g
0.041g
1%
Protein
1.68g
1.5g
0%
Protein per 100 calories
3.9g
1.3g
N/A
Calories per 10 g protein
256kcal
747kcal
N/A
Weight per 100 calories
233g
89g
N/A
Net carbs
8.27g
22.36g
N/A
Sugar
0.6g
0.4g
N/A
Vitamin A
6µg
4µg
0%
Selenium
0.7µg
0.7µg
0%
Monounsaturated fat
0.098g
0.016g
0%
Polyunsaturated fat
0.047g
0.083g
0%
Tryptophan
0.048mg
0.023mg
0%
Threonine
0.055mg
0.069mg
0%
Isoleucine
0.076mg
0.054mg
0%
Leucine
0.083mg
0.111mg
0%
Lysine
0.082mg
0.067mg
0%
Methionine
0.025mg
0.02mg
0%
Phenylalanine
0.043mg
0.082mg
0%
Valine
0.072mg
0.082mg
0%
Histidine
0.024mg
0.034mg
0%
Omega-3 - EPA
0.004g
0g
N/A
Macronutrient Comparison
Macronutrient breakdown side-by-side comparison
4
2%
10%
82%
7%
Protein:
1.68 g
Fats:
0.56 g
Carbs:
9.57 g
Water:
81.58 g
Other:
6.61 g
1
26%
71%
Protein:
1.5 g
Fats:
0.2 g
Carbs:
26.46 g
Water:
70.64 g
Other:
1.2 g
Contains
more
Protein Protein
+12%
Contains
more
Fats Fats
+180%
Contains
more
Water Water
+15.5%
Contains
more
Other Other
+450.8%
Contains
more
Carbs Carbs
+176.5%
Fat Type Comparison
Fat type breakdown side-by-side comparison
1
63%
25%
12%
Saturated fat:
Sat. Fat
0.247 g
Monounsaturated fat:
Mono. Fat
0.098 g
Polyunsaturated fat:
Poly. Fat
0.047 g
2
29%
11%
59%
Saturated fat:
Sat. Fat
0.041 g
Monounsaturated fat:
Mono. Fat
0.016 g
Polyunsaturated fat:
Poly. Fat
0.083 g
Contains
more
Mono. Fat Monounsaturated fat
+512.5%
Contains
less
Sat. Fat Saturated fat
-83.4%
Contains
more
Poly. Fat Polyunsaturated fat
+76.6%