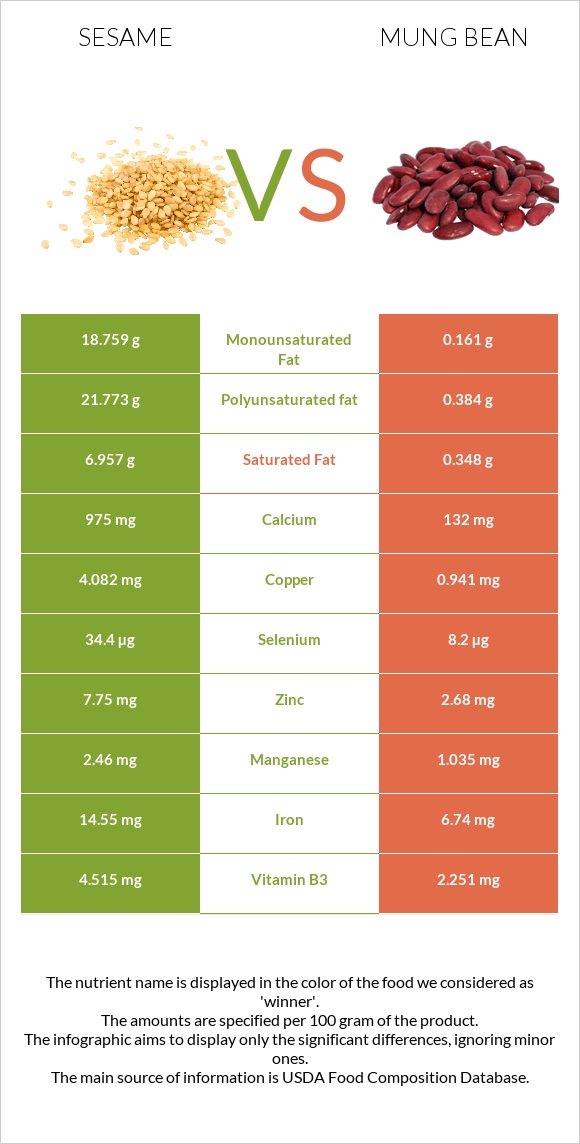
Summary of differences between sesame and mung beans Sesame has more copper, iron, calcium, manganese, selenium, zinc, magnesium, and phosphorus, while mung beans have more folate and vitamin B5. Sesame covers your daily need for copper, 349% more than mung beans. Sesame contains 7 times more calcium than mung beans. While sesame contains 975mg of calcium, mung beans contain only 132mg. These are the specific foods used in this comparison Seeds, sesame seeds, whole, dried and Mung beans, mature seeds, raw .
Infographic
Mineral Comparison
Mineral comparison score is based on the number of minerals by which one or the other food is richer. The "coverage" charts below show how much of the daily needs can be covered by 300 grams of the food.
9
100 g
300 g
1 tbsp - 9g 1 cup - 144g
Magnesium
Magnesium
Calcium
Calcium
Potassium
Potassium
Iron
Iron
Copper
Copper
Zinc
Zinc
Phosphorus
Phosphorus
Sodium
Sodium
Manganese
Manganese
Selenium
Selenium
251%
293%
41%
546%
1361%
211%
270%
1.4%
321%
188%
1
100 g
300 g
1 tbsp - 13g 1 cup - 207g
Magnesium
Magnesium
Calcium
Calcium
Potassium
Potassium
Iron
Iron
Copper
Copper
Zinc
Zinc
Phosphorus
Phosphorus
Sodium
Sodium
Manganese
Manganese
Selenium
Selenium
135%
40%
110%
253%
314%
73%
157%
2%
135%
45%
Vitamin Comparison
Vitamin comparison score is based on the number of vitamins by which one or the other food is richer. The "coverage" charts below show how much of the daily needs can be covered by 300 grams of the food.
3
100 g
300 g
1 tbsp - 9g 1 cup - 144g
Vitamin C
Vit. C
Vitamin D
Vit. D
Vitamin A
Vit. A
Vitamin E
Vit. E
Vitamin B1
Vit. B1
Vitamin B2
Vit. B2
Vitamin B3
Vit. B3
Vitamin B5
Vit. B5
Vitamin B6
Vit. B6
Vitamin B12
Vit. B12
Vitamin K
Vit. K
Folate
Folate
0%
0%
0%
5%
198%
57%
85%
3%
182%
0%
0%
73%
6
100 g
300 g
1 tbsp - 13g 1 cup - 207g
Vitamin C
Vit. C
Vitamin D
Vit. D
Vitamin A
Vit. A
Vitamin E
Vit. E
Vitamin B1
Vit. B1
Vitamin B2
Vit. B2
Vitamin B3
Vit. B3
Vitamin B5
Vit. B5
Vitamin B6
Vit. B6
Vitamin B12
Vit. B12
Vitamin K
Vit. K
Folate
Folate
16%
0%
2%
10%
155%
54%
42%
115%
88%
0%
23%
469%
All nutrients comparison - raw data values
Nutrient
DV% diff.
Copper
4.082mg
0.941mg
349%
Polyunsaturated fat
21.773g
0.384g
143%
Folate
97µg
625µg
132%
Iron
14.55mg
6.74mg
98%
Calcium
975mg
132mg
84%
Fats
49.67g
1.15g
75%
Manganese
2.46mg
1.035mg
62%
Selenium
34.4µg
8.2µg
48%
Zinc
7.75mg
2.68mg
46%
Monounsaturated fat
18.759g
0.161g
46%
Magnesium
351mg
189mg
39%
Phosphorus
629mg
367mg
37%
Vitamin B5
0.05mg
1.91mg
37%
Vitamin B6
0.79mg
0.382mg
31%
Saturated fat
6.957g
0.348g
30%
Potassium
468mg
1246mg
23%
Fiber
11.8g
16.3g
18%
Vitamin B1
0.791mg
0.621mg
14%
Vitamin B3
4.515mg
2.251mg
14%
Carbs
23.45g
62.62g
13%
Choline
25.6mg
97.9mg
13%
Protein
17.73g
23.86g
12%
Calories
573kcal
347kcal
11%
Vitamin K
0µg
9µg
8%
Vitamin C
0mg
4.8mg
5%
Vitamin E
0.25mg
0.51mg
2%
Vitamin A
0µg
6µg
1%
Vitamin B2
0.247mg
0.233mg
1%
Protein per 100 calories
3.1g
6.9g
N/A
Calories per 10 g protein
323kcal
145kcal
N/A
Weight per 100 calories
17g
29g
N/A
Unsaturated / Saturated Fat ratio
5.8
1.6
N/A
Net carbs
11.65g
46.32g
N/A
Sugar
0.3g
6.6g
N/A
Sodium
11mg
15mg
0%
Tryptophan
0.388mg
0.26mg
0%
Threonine
0.736mg
0.782mg
0%
Isoleucine
0.763mg
1.008mg
0%
Leucine
1.358mg
1.847mg
0%
Lysine
0.569mg
1.664mg
0%
Methionine
0.586mg
0.286mg
0%
Phenylalanine
0.94mg
1.443mg
0%
Valine
0.99mg
1.237mg
0%
Histidine
0.522mg
0.695mg
0%
Macronutrient Comparison
Macronutrient breakdown side-by-side comparison
2
18%
50%
23%
5%
4%
Protein:
17.73 g
Fats:
49.67 g
Carbs:
23.45 g
Water:
4.69 g
Other:
4.46 g
3
24%
63%
9%
3%
Protein:
23.86 g
Fats:
1.15 g
Carbs:
62.62 g
Water:
9.05 g
Other:
3.32 g
Contains
more
Fats Fats
+4219.1%
Contains
more
Other Other
+34.3%
Contains
more
Protein Protein
+34.6%
Contains
more
Carbs Carbs
+167%
Contains
more
Water Water
+93%
Fat Type Comparison
Fat type breakdown side-by-side comparison
2
15%
40%
46%
Saturated fat:
Sat. Fat
6.957 g
Monounsaturated fat:
Mono. Fat
18.759 g
Polyunsaturated fat:
Poly. Fat
21.773 g
1
39%
18%
43%
Saturated fat:
Sat. Fat
0.348 g
Monounsaturated fat:
Mono. Fat
0.161 g
Polyunsaturated fat:
Poly. Fat
0.384 g
Contains
more
Mono. Fat Monounsaturated fat
+11551.6%
Contains
more
Poly. Fat Polyunsaturated fat
+5570.1%
Contains
less
Sat. Fat Saturated fat
-95%