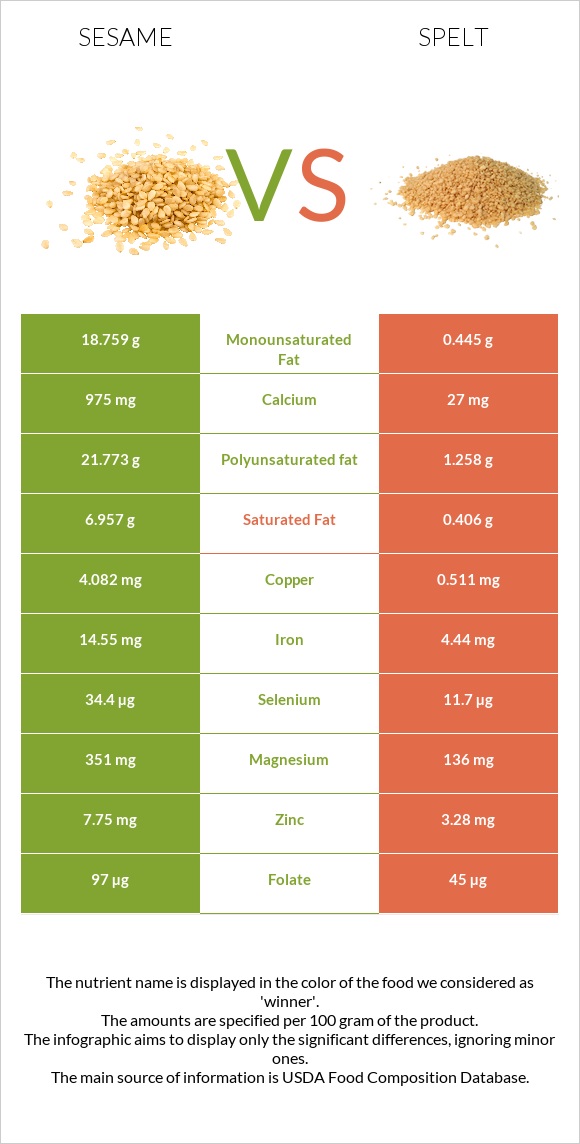
Summary of differences between sesame and spelt The amount of copper, iron, calcium, magnesium, vitamin B6, selenium, zinc, vitamin B1, and phosphorus in sesame is higher than in spelt. Sesame covers your daily need for copper, 397% more than spelt. Sesame contains 36 times more calcium than spelt. While sesame contains 975mg of calcium, spelt contains only 27mg. The amount of saturated fat in spelt is lower. These are the specific foods used in this comparison Seeds, sesame seeds, whole, dried and Spelt, uncooked .
Infographic
Mineral Comparison
Mineral comparison score is based on the number of minerals by which one or the other food is richer. The "coverage" charts below show how much of the daily needs can be covered by 300 grams of the food.
8
100 g
300 g
1 tbsp - 9g 1 cup - 144g
Magnesium
Magnesium
Calcium
Calcium
Potassium
Potassium
Iron
Iron
Copper
Copper
Zinc
Zinc
Phosphorus
Phosphorus
Sodium
Sodium
Manganese
Manganese
Selenium
Selenium
251%
293%
41%
546%
1361%
211%
270%
1.4%
321%
188%
2
100 g
300 g
1 cup - 174g
Magnesium
Magnesium
Calcium
Calcium
Potassium
Potassium
Iron
Iron
Copper
Copper
Zinc
Zinc
Phosphorus
Phosphorus
Sodium
Sodium
Manganese
Manganese
Selenium
Selenium
97%
8.1%
34%
167%
170%
89%
172%
1%
389%
64%
Vitamin Comparison
Vitamin comparison score is based on the number of vitamins by which one or the other food is richer. The "coverage" charts below show how much of the daily needs can be covered by 300 grams of the food.
4
100 g
300 g
1 tbsp - 9g 1 cup - 144g
Vitamin C
Vit. C
Vitamin D
Vit. D
Vitamin A
Vit. A
Vitamin E
Vit. E
Vitamin B1
Vit. B1
Vitamin B2
Vit. B2
Vitamin B3
Vit. B3
Vitamin B5
Vit. B5
Vitamin B6
Vit. B6
Vitamin B12
Vit. B12
Vitamin K
Vit. K
Folate
Folate
0%
0%
0%
5%
198%
57%
85%
3%
182%
0%
0%
73%
4
100 g
300 g
1 cup - 174g
Vitamin C
Vit. C
Vitamin D
Vit. D
Vitamin A
Vit. A
Vitamin E
Vit. E
Vitamin B1
Vit. B1
Vitamin B2
Vit. B2
Vitamin B3
Vit. B3
Vitamin B5
Vit. B5
Vitamin B6
Vit. B6
Vitamin B12
Vit. B12
Vitamin K
Vit. K
Folate
Folate
0%
0%
0%
16%
91%
26%
128%
64%
53%
0%
9%
34%
All nutrients comparison - raw data values
Nutrient
DV% diff.
Copper
4.082mg
0.511mg
397%
Polyunsaturated fat
21.773g
1.258g
137%
Iron
14.55mg
4.44mg
126%
Calcium
975mg
27mg
95%
Fats
49.67g
2.43g
73%
Magnesium
351mg
136mg
51%
Monounsaturated fat
18.759g
0.445g
46%
Vitamin B6
0.79mg
0.23mg
43%
Zinc
7.75mg
3.28mg
41%
Selenium
34.4µg
11.7µg
41%
Vitamin B1
0.791mg
0.364mg
36%
Phosphorus
629mg
401mg
33%
Saturated fat
6.957g
0.406g
30%
Manganese
2.46mg
2.983mg
23%
Starch
53.92g
22%
Vitamin B5
0.05mg
1.068mg
20%
Carbs
23.45g
70.19g
16%
Vitamin B3
4.515mg
6.843mg
15%
Folate
97µg
45µg
13%
Calories
573kcal
338kcal
12%
Vitamin B2
0.247mg
0.113mg
10%
Protein
17.73g
14.57g
6%
Choline
25.6mg
5%
Fiber
11.8g
10.7g
4%
Vitamin E
0.25mg
0.79mg
4%
Vitamin K
0µg
3.6µg
3%
Potassium
468mg
388mg
2%
Protein per 100 calories
3.1g
4.3g
N/A
Calories per 10 g protein
323kcal
232kcal
N/A
Weight per 100 calories
17g
30g
N/A
Unsaturated / Saturated Fat ratio
5.8
4.2
N/A
Net carbs
11.65g
59.49g
N/A
Sugar
0.3g
6.82g
N/A
Sodium
11mg
8mg
0%
Tryptophan
0.388mg
0.132mg
0%
Threonine
0.736mg
0.443mg
0%
Isoleucine
0.763mg
0.552mg
0%
Leucine
1.358mg
1.07mg
0%
Lysine
0.569mg
0.409mg
0%
Methionine
0.586mg
0.258mg
0%
Phenylalanine
0.94mg
0.737mg
0%
Valine
0.99mg
0.681mg
0%
Histidine
0.522mg
0.36mg
0%
Fructose
0.24g
0%
Omega-3 - ALA
0.065g
N/A
Macronutrient Comparison
Macronutrient breakdown side-by-side comparison
3
18%
50%
23%
5%
4%
Protein:
17.73 g
Fats:
49.67 g
Carbs:
23.45 g
Water:
4.69 g
Other:
4.46 g
2
15%
2%
70%
11%
2%
Protein:
14.57 g
Fats:
2.43 g
Carbs:
70.19 g
Water:
11.02 g
Other:
1.79 g
Contains
more
Protein Protein
+21.7%
Contains
more
Fats Fats
+1944%
Contains
more
Other Other
+149.2%
Contains
more
Carbs Carbs
+199.3%
Contains
more
Water Water
+135%
Fat Type Comparison
Fat type breakdown side-by-side comparison
2
15%
40%
46%
Saturated fat:
Sat. Fat
6.957 g
Monounsaturated fat:
Mono. Fat
18.759 g
Polyunsaturated fat:
Poly. Fat
21.773 g
1
19%
21%
60%
Saturated fat:
Sat. Fat
0.406 g
Monounsaturated fat:
Mono. Fat
0.445 g
Polyunsaturated fat:
Poly. Fat
1.258 g
Contains
more
Mono. Fat Monounsaturated fat
+4115.5%
Contains
more
Poly. Fat Polyunsaturated fat
+1630.8%
Contains
less
Sat. Fat Saturated fat
-94.2%