Seeds, sunflower seed kernels from shell, dry roasted, with salt added vs. Seeds, sunflower seed kernels, dry roasted, with salt added — In-Depth Nutrition Comparison
Compare
Summary of differences between seeds, sunflower seed kernels from shell, dry roasted, with salt added and seeds, sunflower seed kernels, dry roasted, with salt added
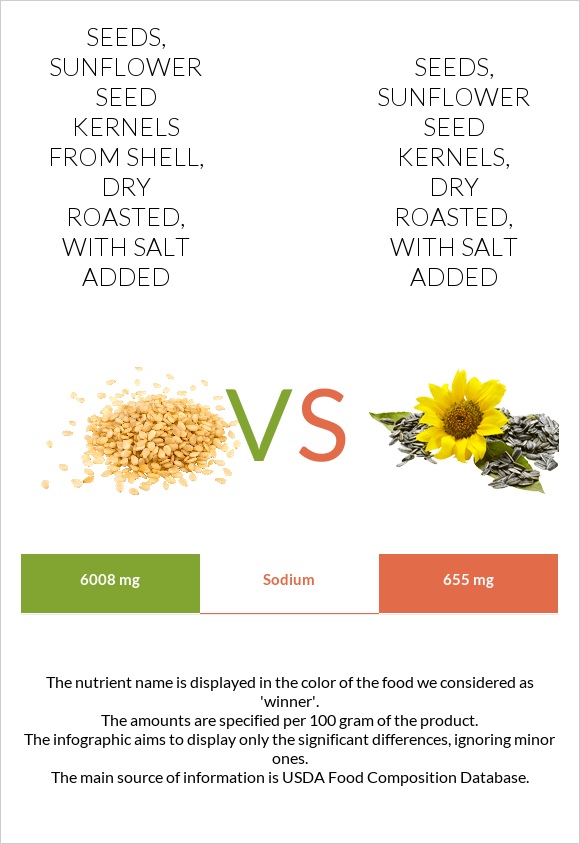
- Seeds, sunflower seed kernels from shell, dry roasted, with salt added covers your daily need for sodium, 233% more than seeds, sunflower seed kernels, dry roasted, with salt added.
- Seeds, sunflower seed kernels, dry roasted, with salt added has less sodium.
These are the specific foods used in this comparison Seeds, sunflower seed kernels from shell, dry roasted, with salt added and Seeds, sunflower seed kernels, dry roasted, with salt added.
Infographic
Infographic link
Mineral Comparison
Mineral comparison score is based on the number of minerals by which one or the other food is richer. The "coverage" charts below show how much of the daily needs can be covered by 300 grams of the food.
| Contains less SodiumSodium | -89.1% |
Vitamin Comparison
Vitamin comparison score is based on the number of vitamins by which one or the other food is richer. The "coverage" charts below show how much of the daily needs can be covered by 300 grams of the food.
All nutrients comparison - raw data values
| Nutrient |  |
 |
DV% diff. |
| Sodium | 6008mg | 655mg | 233% |
| Carbs | 15.31g | 24.07g | 3% |
| Calories | 546kcal | 582kcal | 2% |
| Protein | 19.33g | 19.33g | 0% |
| Fats | 49.8g | 49.8g | 0% |
| Vitamin C | 1.4mg | 1.4mg | 0% |
| Net carbs | 6.31g | 15.07g | N/A |
| Magnesium | 129mg | 129mg | 0% |
| Calcium | 70mg | 70mg | 0% |
| Potassium | 850mg | 850mg | 0% |
| Iron | 3.8mg | 3.8mg | 0% |
| Sugar | 2.73g | 2.73g | N/A |
| Fiber | 9g | 9g | 0% |
| Copper | 1.83mg | 1.83mg | 0% |
| Zinc | 5.29mg | 5.29mg | 0% |
| Phosphorus | 1155mg | 1155mg | 0% |
| Vitamin E | 26.1mg | 26.1mg | 0% |
| Manganese | 2.11mg | 2.11mg | 0% |
| Selenium | 79.3µg | 79.3µg | 0% |
| Vitamin B1 | 0.106mg | 0.106mg | 0% |
| Vitamin B2 | 0.246mg | 0.246mg | 0% |
| Vitamin B3 | 7.042mg | 7.042mg | 0% |
| Vitamin B5 | 7.042mg | 7.042mg | 0% |
| Vitamin B6 | 0.804mg | 0.804mg | 0% |
| Vitamin K | 2.7µg | 2.7µg | 0% |
| Folate | 237µg | 237µg | 0% |
| Choline | 55.1mg | 55.1mg | 0% |
| Saturated fat | 5.219g | 5.219g | 0% |
| Monounsaturated fat | 9.505g | 9.505g | 0% |
| Polyunsaturated fat | 32.884g | 32.884g | 0% |
| Tryptophan | 0.295mg | 0.295mg | 0% |
| Threonine | 0.788mg | 0.788mg | 0% |
| Isoleucine | 0.967mg | 0.967mg | 0% |
| Leucine | 1.408mg | 1.408mg | 0% |
| Lysine | 0.795mg | 0.795mg | 0% |
| Methionine | 0.42mg | 0.42mg | 0% |
| Phenylalanine | 0.992mg | 0.992mg | 0% |
| Valine | 1.116mg | 1.116mg | 0% |
| Histidine | 0.536mg | 0.536mg | 0% |
Macronutrient Comparison
Macronutrient breakdown side-by-side comparison
Protein:
19.33 g
Fats:
49.8 g
Carbs:
15.31 g
Water:
1.2 g
Other:
14.36 g
Protein:
19.33 g
Fats:
49.8 g
Carbs:
24.07 g
Water:
1.2 g
Other:
5.6 g
| Contains more OtherOther | +156.4% |
| Contains more CarbsCarbs | +57.2% |
~equal in
Protein
~19.33g
~equal in
Fats
~49.8g
~equal in
Water
~1.2g
Fat Type Comparison
Fat type breakdown side-by-side comparison
Saturated fat:
Sat. Fat
5.219 g
Monounsaturated fat:
Mono. Fat
9.505 g
Polyunsaturated fat:
Poly. Fat
32.884 g
Saturated fat:
Sat. Fat
5.219 g
Monounsaturated fat:
Mono. Fat
9.505 g
Polyunsaturated fat:
Poly. Fat
32.884 g
~equal in
Saturated fat
~5.219g
~equal in
Monounsaturated fat
~9.505g
~equal in
Polyunsaturated fat
~32.884g
Carbohydrate type comparison
Carbohydrate type breakdown side-by-side comparison
Starch:
0 g
Sucrose:
2.7 g
Glucose:
0.03 g
Fructose:
0 g
Lactose:
0 g
Maltose:
0 g
Galactose:
0 g
Starch:
0 g
Sucrose:
2.7 g
Glucose:
0.03 g
Fructose:
0 g
Lactose:
0 g
Maltose:
0 g
Galactose:
0 g
~equal in
Starch
~0g
~equal in
Sucrose
~2.7g
~equal in
Glucose
~0.03g
~equal in
Fructose
~0g
~equal in
Lactose
~0g
~equal in
Maltose
~0g
~equal in
Galactose
~0g